Viewing GeoSWMM 2D Outputs
Map Visualization
There are two ways to visualize the 2D flood map,
- After the 2D model simulation is complete, save the GeoSWMM project and maximum flood water depth map will be generated immediately
- From the ArcGIS Pro layer properties
User can view and customize the 2D flood result from the 2D cell layer properties in Arc map. Steps are:
- Right click on the Cells 2D layer in the SWMM geodatabase in the ArcGIS Pro map ToC.
- Go to symbology
- In Primary Symbology, select unique values and in Field 1assign the value “MAXDEPTH”/ “MAXWSE”/ “MAX VOLUME”
- Classify the values in appropriate range and color ramp
- Click OK
To show 2D flood result field’s attribute value in the map:
- Right click on the Cells 2D Layer in the SWMM geodatabase in the ArcGIS Pro map ToC
- Go to “Labeling Properties”
- Select the Label field “MAXDEPTH”/ “MAXWSE”/ “MAX VOLUME” from fields
- Click Apply
Map Exporting
To export the 2D flood results:
- Use Generate Flood Raster tool in GeoSWMM 2D
Export map using “Generate Flood Raster” tool
The Generate Flood Raster tool can be used to create and visualize higher resolution raster file of 2D flood model results. This tool will activate after the simulation of 2D model. With the aid of this tool, the research area's maximum water depth and water surface elevation (wse) can be visualized for the duration of the simulation. The output of the 2D findings requires the management of a separate geodatabase. The user has the option to simultaneously select any or both of the depth and WSE rasters.
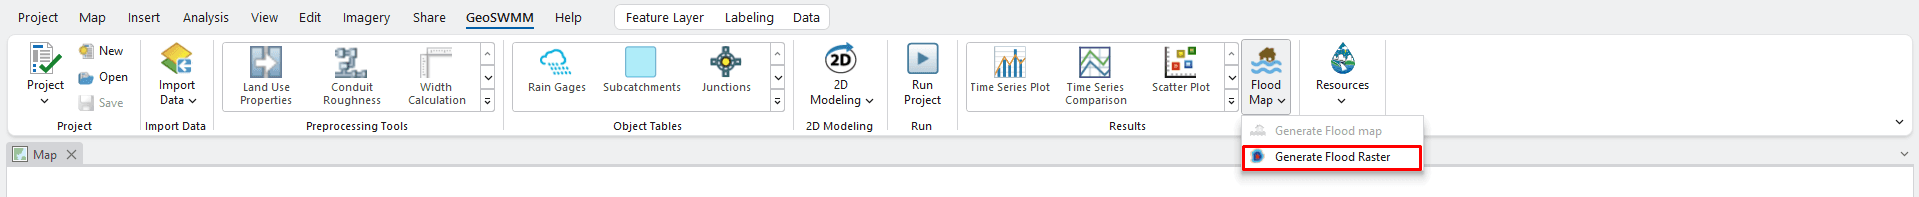
Figure 11.28 : Generate Flood Raster Tool option in 2D Modeling
The interface of this tool looks like the following Figure.
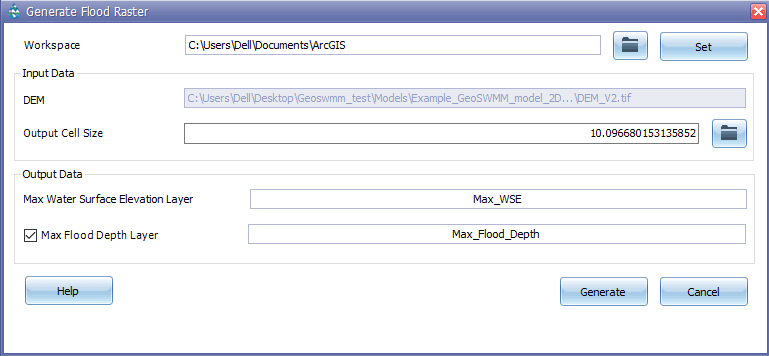
Steps
Set the default geodatabase or browse a predefined geodatabase file.
DEM layer is directly assigned from GeoSWMM project
Assign the output raster cell size or import the raster of required cell size, otherwise keep it as defaults
Check the required output raster
Update the raster name or keep it as defaults
Click “Generate”
Map Customization
ArcGIS Pro tools can be used to customize the output of “Generate flood raster tool”. Contour map and Flood boundary layer can be generated from the output raster file.
To generate Contour map:
- Select “Contour” 3D analyst tool from ArcGIS Pro tools
- Specify the Max depth raster or WSE raster as input raster
- Select the directory for output Contour
- Select the Contour interval
- Click OK
To generate Flood Boundary:
- At first search on tool bar “Raster calculator”
- Click “Raster calculator” tool
- Set the expression to find the non-zero value of the raster file.
- Specify the output raster location
- Click ok
- Go to: Spatial Analyst tools > Reclass > Reclassify
- Reclassify the raster according to user’s preference
- Specify the output path
- Click OK
- Go to “Raster to polygon” tool
- Select the reclassified raster as input raster
- Specify the output raster path
- Click OK