Viewing a Statistics Report
A Statistics Report can be generated from the time series of simulation results. For a given object and variable this report will do the following:
- Segregate the simulation period into a sequence of non-overlapping events, either by day, month or by flow above some minimum threshold value.
- compute a statistical value that characterizes each event.
- compute summary statistics for the entire set of event value.
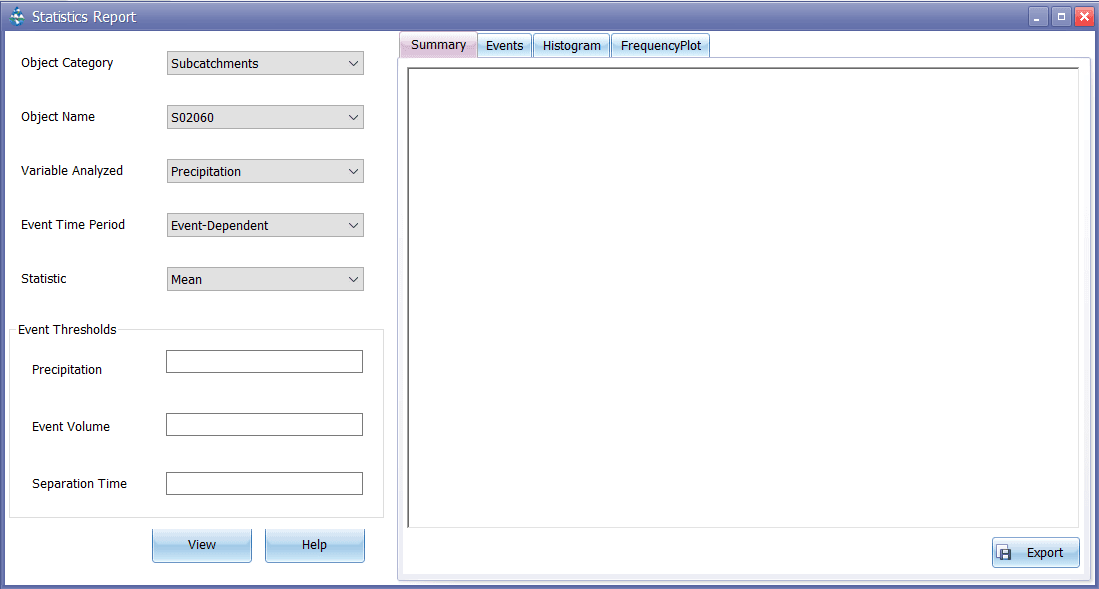
It contains the following data fields:
Table 10.2 : Statistics report information
Data Fields | Information |
|---|---|
Object Category | Subcatchment Link |
Object Name | Enter the ID name of the object to analyze. |
Variable Analyzed | Enter the name of the variable to be analyzed. |
Event Time period | Select the length of the time period that defines an event. e.g daily, monthly, or event-dependent. |
Statistic | Choose an event statistic to be analyzed. Such as mean value, event total, event duration and inter event time. |
Event thresholds | These define minimum values that must be exceeded for an event to occur. |
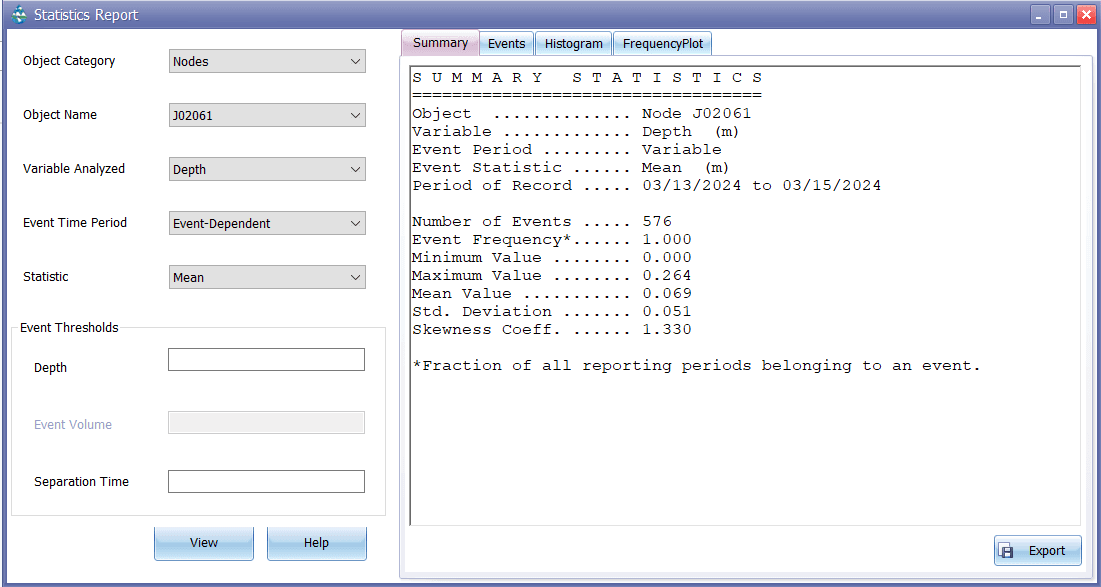
After the choices made on the Statistics Selection, dialog form is processed and a Statistics Reports is produced as shown below.
The report consists of four tabbed pages that contain:
- a table of event summary statistics
- a table of rank-ordered event periods, including their date, duration, and magnitude
- a histogram plot of the chosen event statistic
- an exceedance frequency plot of the event values.