Viewing Model Results
Viewing Results with a Table
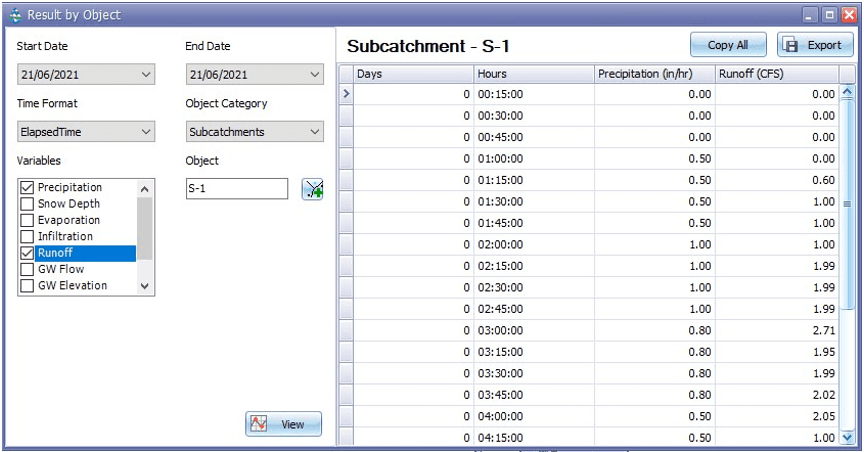
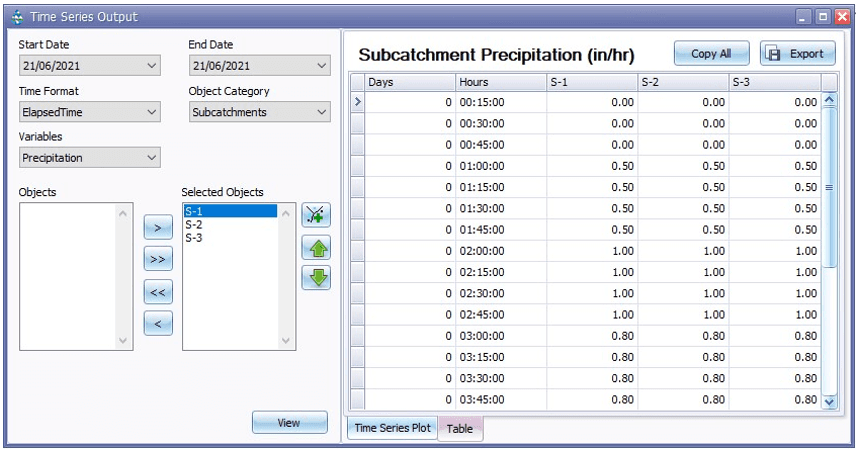
Time series results for selected variables and objects can be viewed also in a tabular format in GeoSWMM. The user can view the result table in two ways:
- Using the Tabular Result by Object option by clicking on the (
 ) button (Figure 10.8 ).
 - In the Time Series Plot or the Scatter Plot option where the user can also view the plotting data in a table (Figure 10.9).