Watershed Delineation Tool
The Watershed Delineation Tool in GeoSWMM performs GIS based topographic analysis to define the subcatchment boundaries in a SWMM project. Using DEM information of the project area, the tool enables users to analyze the model topography and identify the stream layout and to delineate subcatchment boundaries at given locations (points of interest).
Subcatchment properties (e.g. area, shape, surface slope, imperviousness, outlet location etc.) play quite significant roles during any hydrologic event and therefore their accurate representation is essential to the SWMM model. The Watershed Delineation Tool helps the GeoSWMM users efficiently create and manage their model subcatchments and associated streams and outlets. The tool provides the utmost flexibility in assigning desired outlets (or pour points) and generating their contributory watershed areas in a GeoSWMM project.
Watershed Delineation Principles
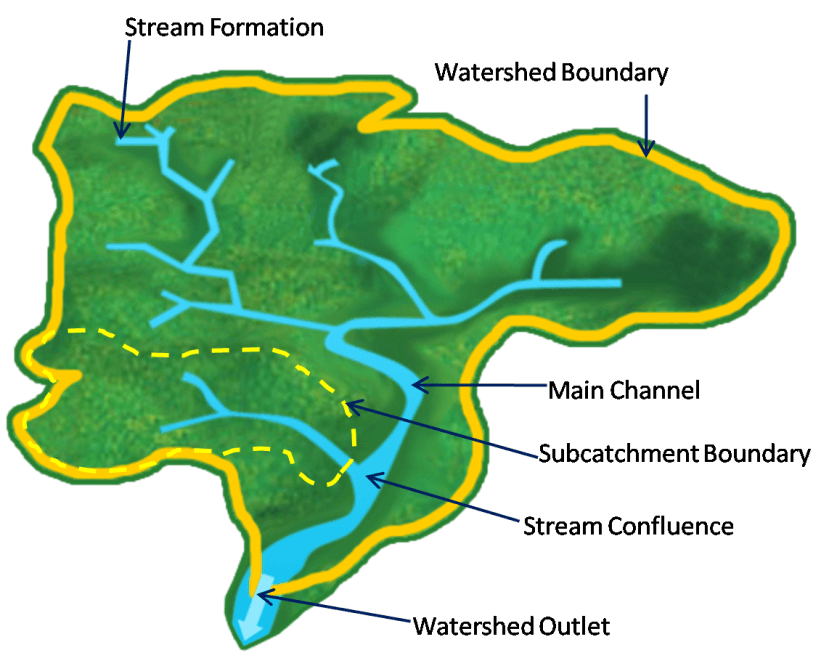
In hydrology, a watershed is an upslope drainage area that contributes water flow to a common outlet during a hydrologic event. The contributory drainage area is also referred to as the catchment or the drainage basin. The outlet (or the water pour point) is the point on the surface at which water flows out of a catchment area. It is the point with the lowest elevation along the catchment boundary.
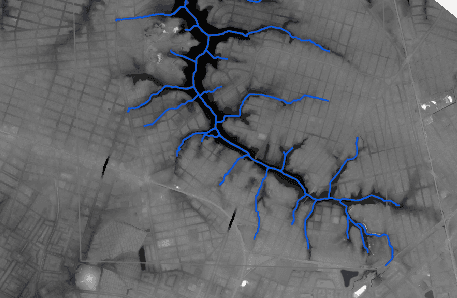
A catchment may contain smaller watersheds, called subcatchments or subwatersheds. The outlet points define the shape and spatial extent of the subcatchment boundaries. The number of the subcatchments is equal to the number of outlets. The stream network that conveys water from a number of subcatchments to a common outlet looks like the veins of a leaf, with the position of the outlet at the end of the midrib (Figure 6.1).
A watershed segmentation process, commonly referred to as the watershed delineation, generates the subcatchments for a set of outlets within a drainage basin. It is an essential task for an accurate representation of the hydrologic and hydraulic components in a SWMM model. However, if a user already has the previously developed subcatchment boundaries for their project area, then watershed delineation may not be required in a GeoSWMM project.
The Watershed Delineation Tool is an interactive tool to aid users automatically delineate subcatchment boundaries. The Watershed Delineation Tool in GeoSWMM primarily models the flow of water across an area of interest. The terrain of the area determines the extent of drainage area and the direction of flow during a hydrologic event. In GIS, the terrain data are widely represented by a Digital Elevation Model (DEM).
The Watershed Delineation Tool works with user supplied DEM data (in raster or grid format) to segment the model watershed boundary into multiple subcatchments. This process is known as automatic delineation. The accuracy of watershed delineation, therefore, depends on the resolution (e.g. grid cell size) of the DEM data.
Subcatchment outlets are the basis of watershed segmentation, and they are usually specified at the stream confluences, gauge locations, hydraulic structure locations, and at any other points of interest. However, the stream formation is not essential for watershed delineation unless the user wants to specify the stream confluences as the subcatchment outlets.
Tool Features
The Watershed Delineation Tool manages GIS datasets within a geodatabase and automates the user-defined workflow to delineate watersheds and subcatchments. It allows users to process DEM data, create and manage stream networks, define outlets, and delineate subcatchment boundaries with high spatial accuracy. The tool interface is organized into eight functional segments, grouped under three main categories:
Primary Input
- Specify Project Outfall
- Specify DEM
Project-Specific Inputs (optional, depending on project scope and available data)
- Import Sewer Network
- Import Streams
- Stream Burn-in
- Delineate Natural Streams
- Adjust Outlets
Final Section
- Delineate Watershed
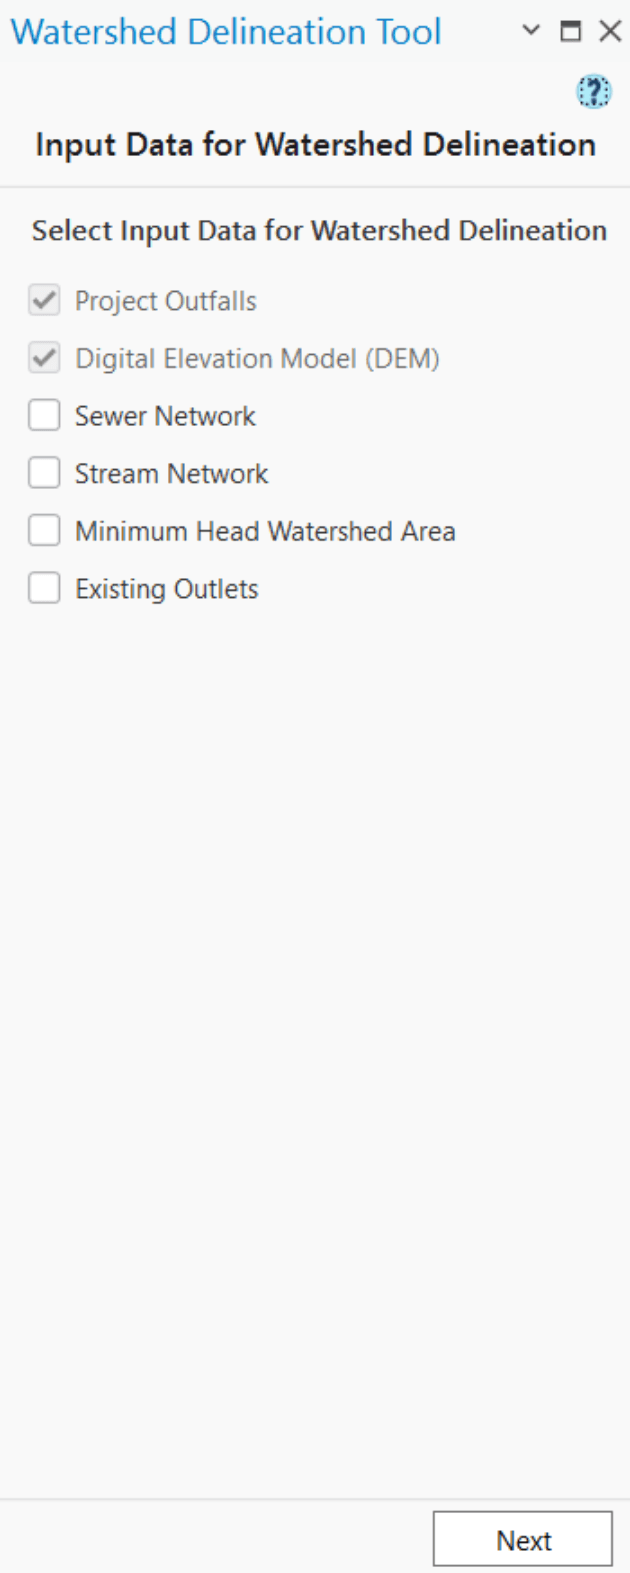
When launched, the Watershed Delineation Tool displays a configuration window allowing users to customize the workflow based on available data such as storm sewers, natural streams, or outlets. By default, “Project outfall” and “DEM” are pre-selected (Fig 6.2). Additional options can be enabled depending on the project’s complexity and available datasets. The following sections describe each functional component in detail.
Primary Inputs
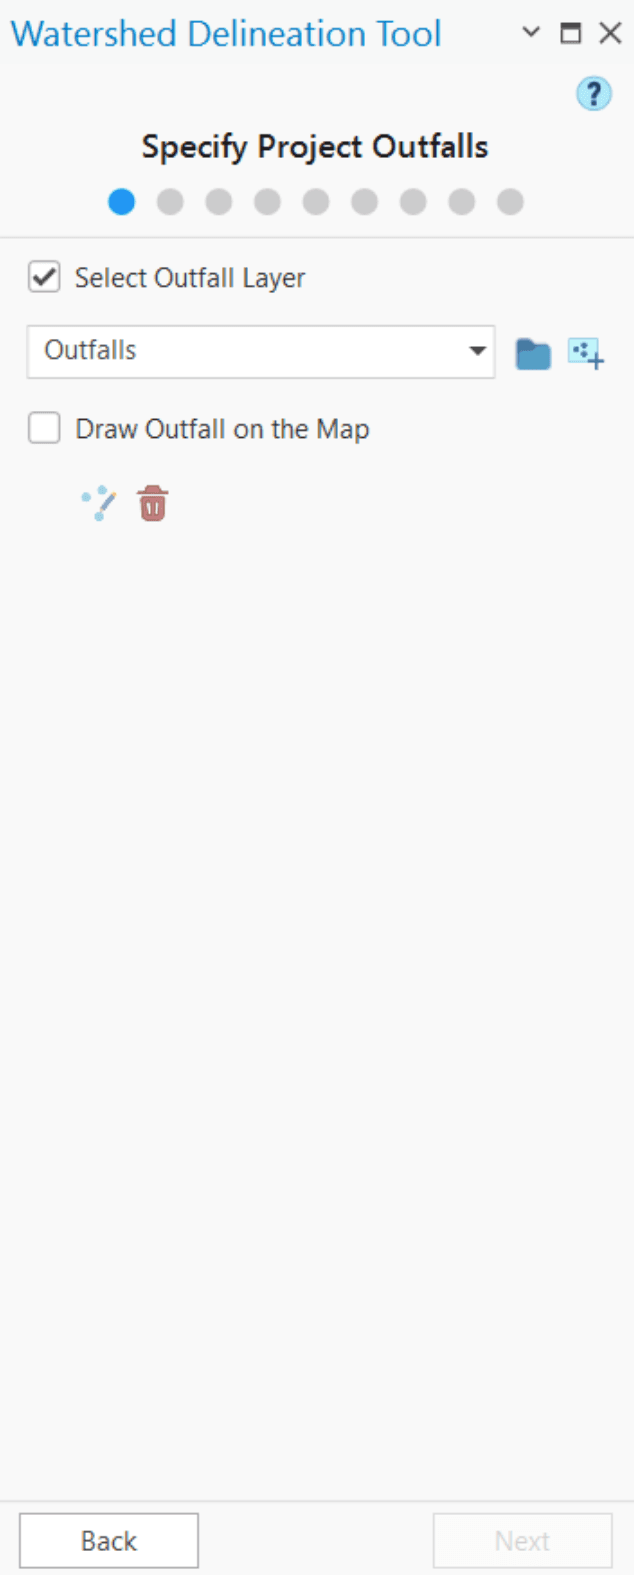
Specify Project Outfalls:
Select Outfall Layer:
Outfalls represent the downstream end nodes of the drainage or sewer system, defining where discharge exits the model. These outfalls can be selected from a map layer or imported by browsing local files. Clicking the Add (![]() ) button adds the selected outfall layer to the map. (Fig 6.3)
) button adds the selected outfall layer to the map. (Fig 6.3)
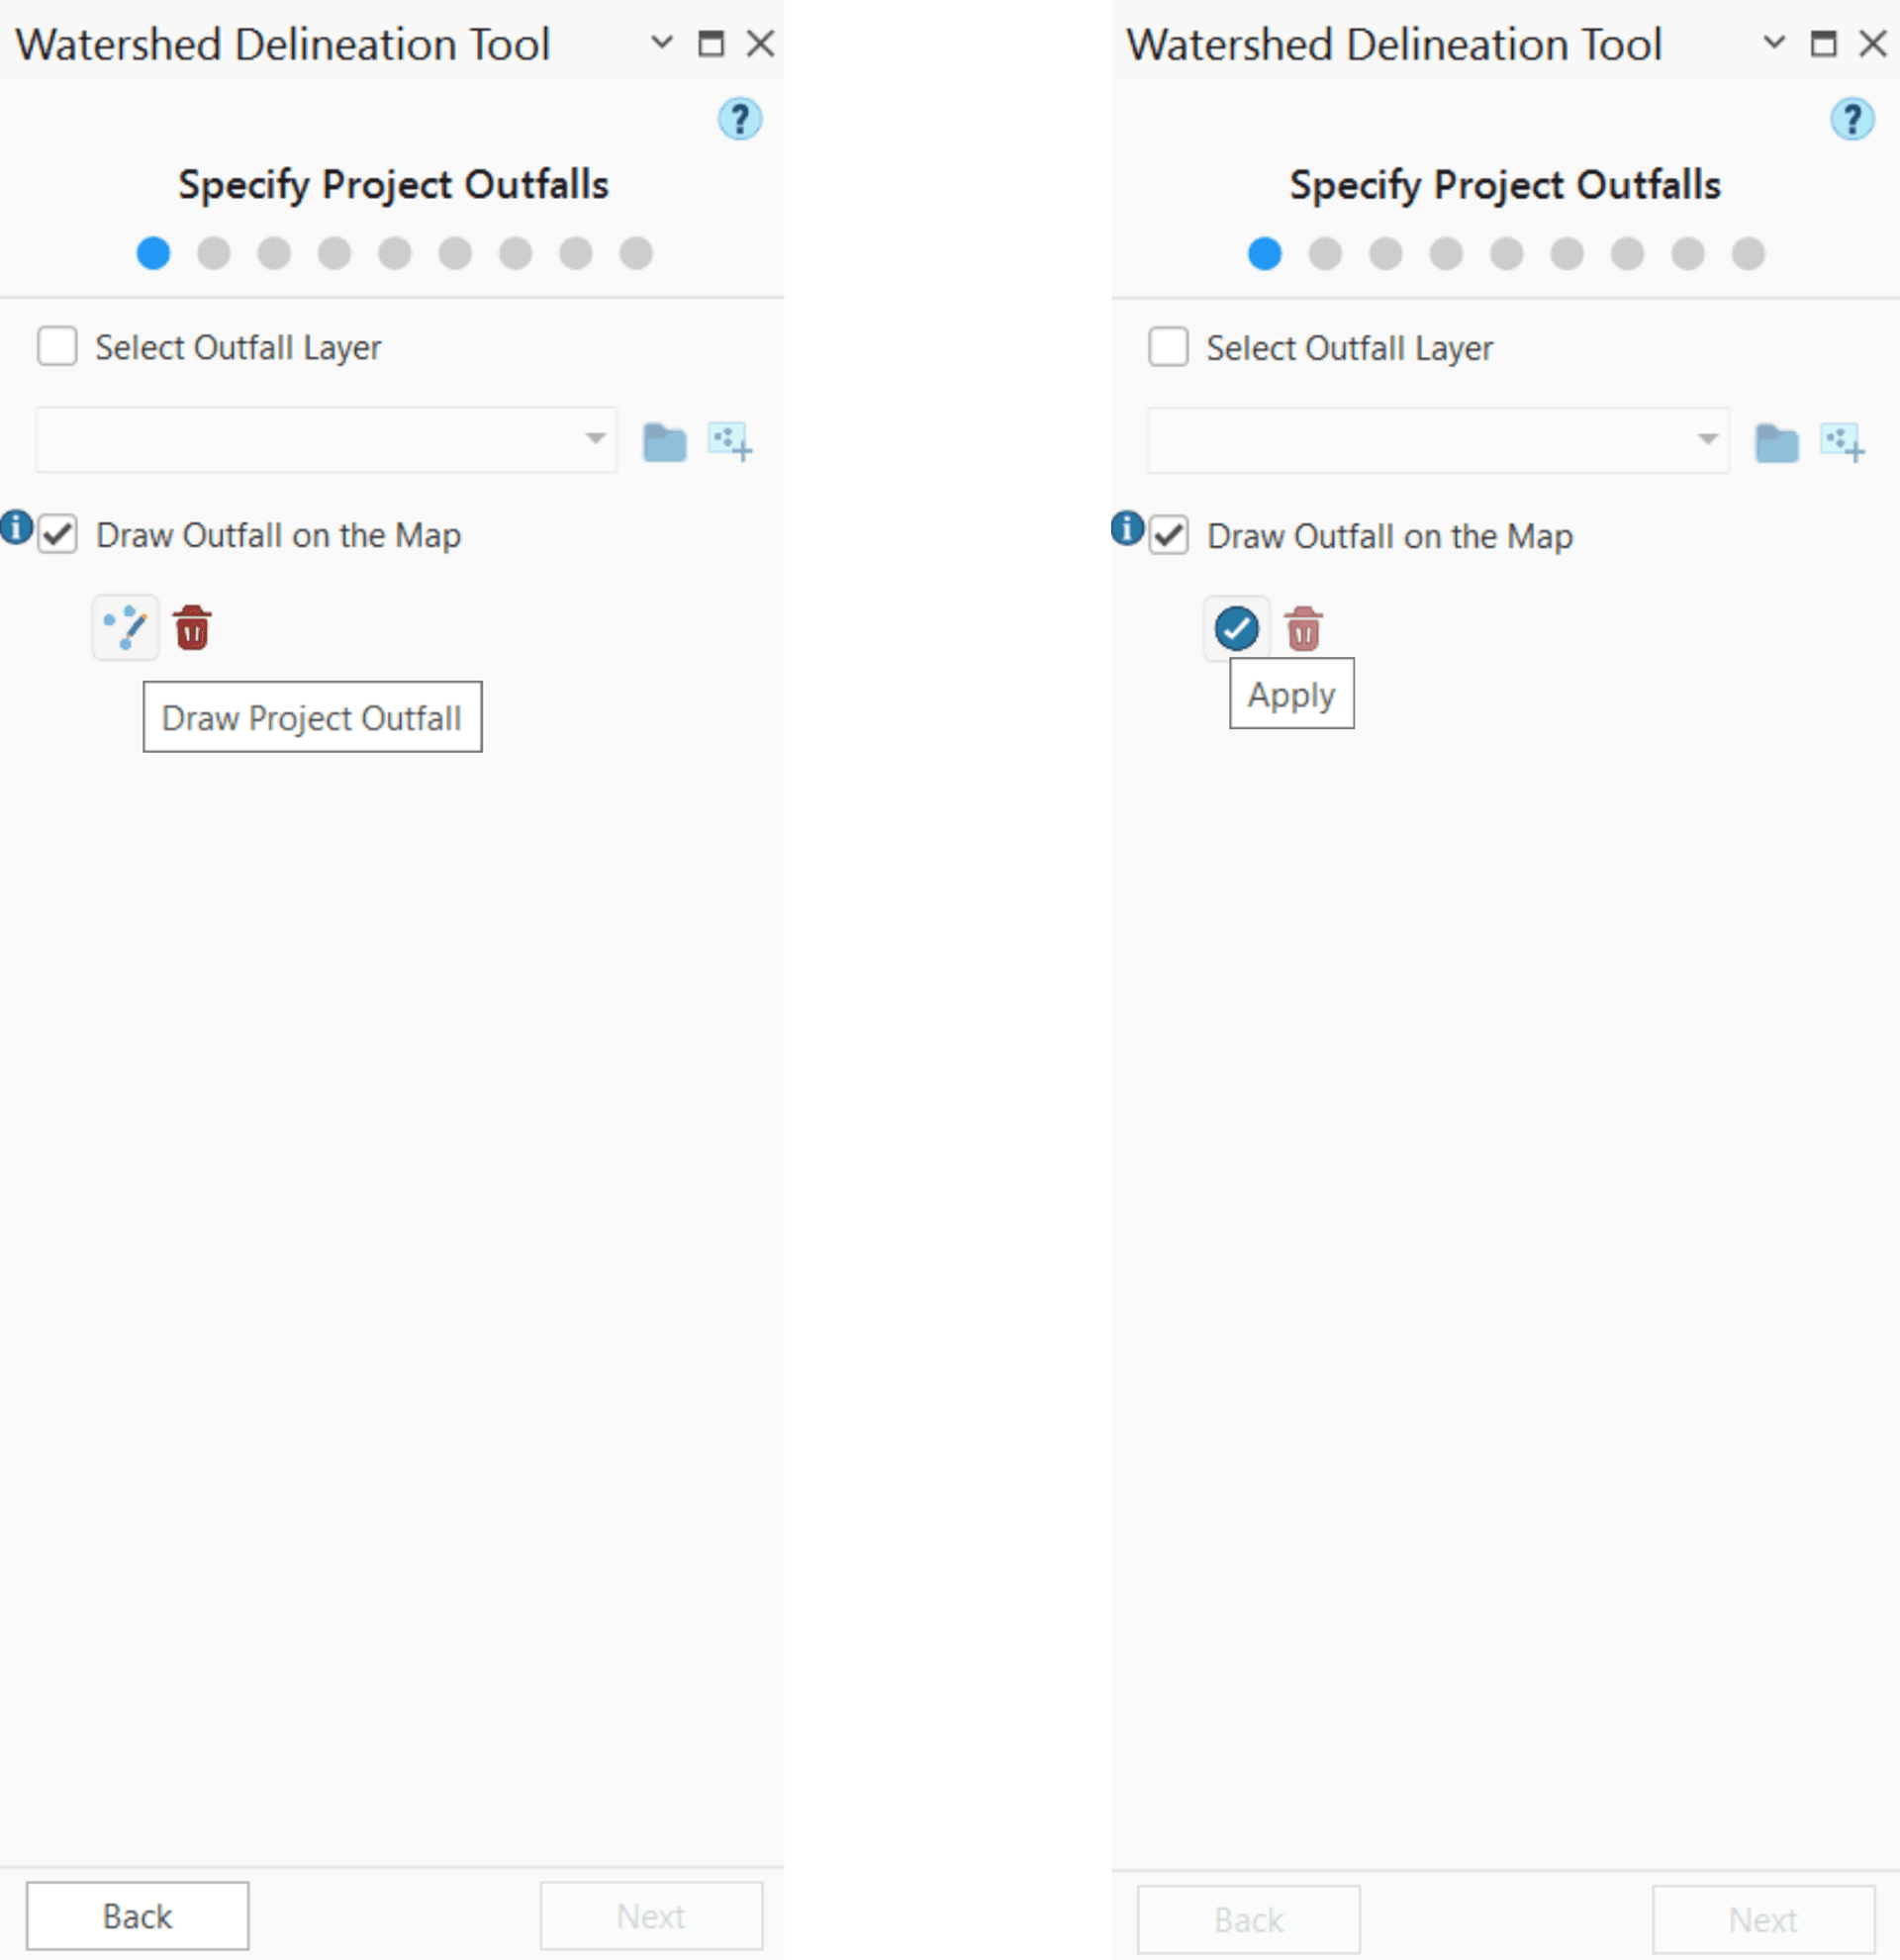
Draw Outfall on the Map:
Users may also define outfalls manually. After checking the Draw Outfall option, the Draw (![]() ) and Delete (
) and Delete (![]() ) tools become active, allowing users to add or delete outfalls directly on the map.
) tools become active, allowing users to add or delete outfalls directly on the map.
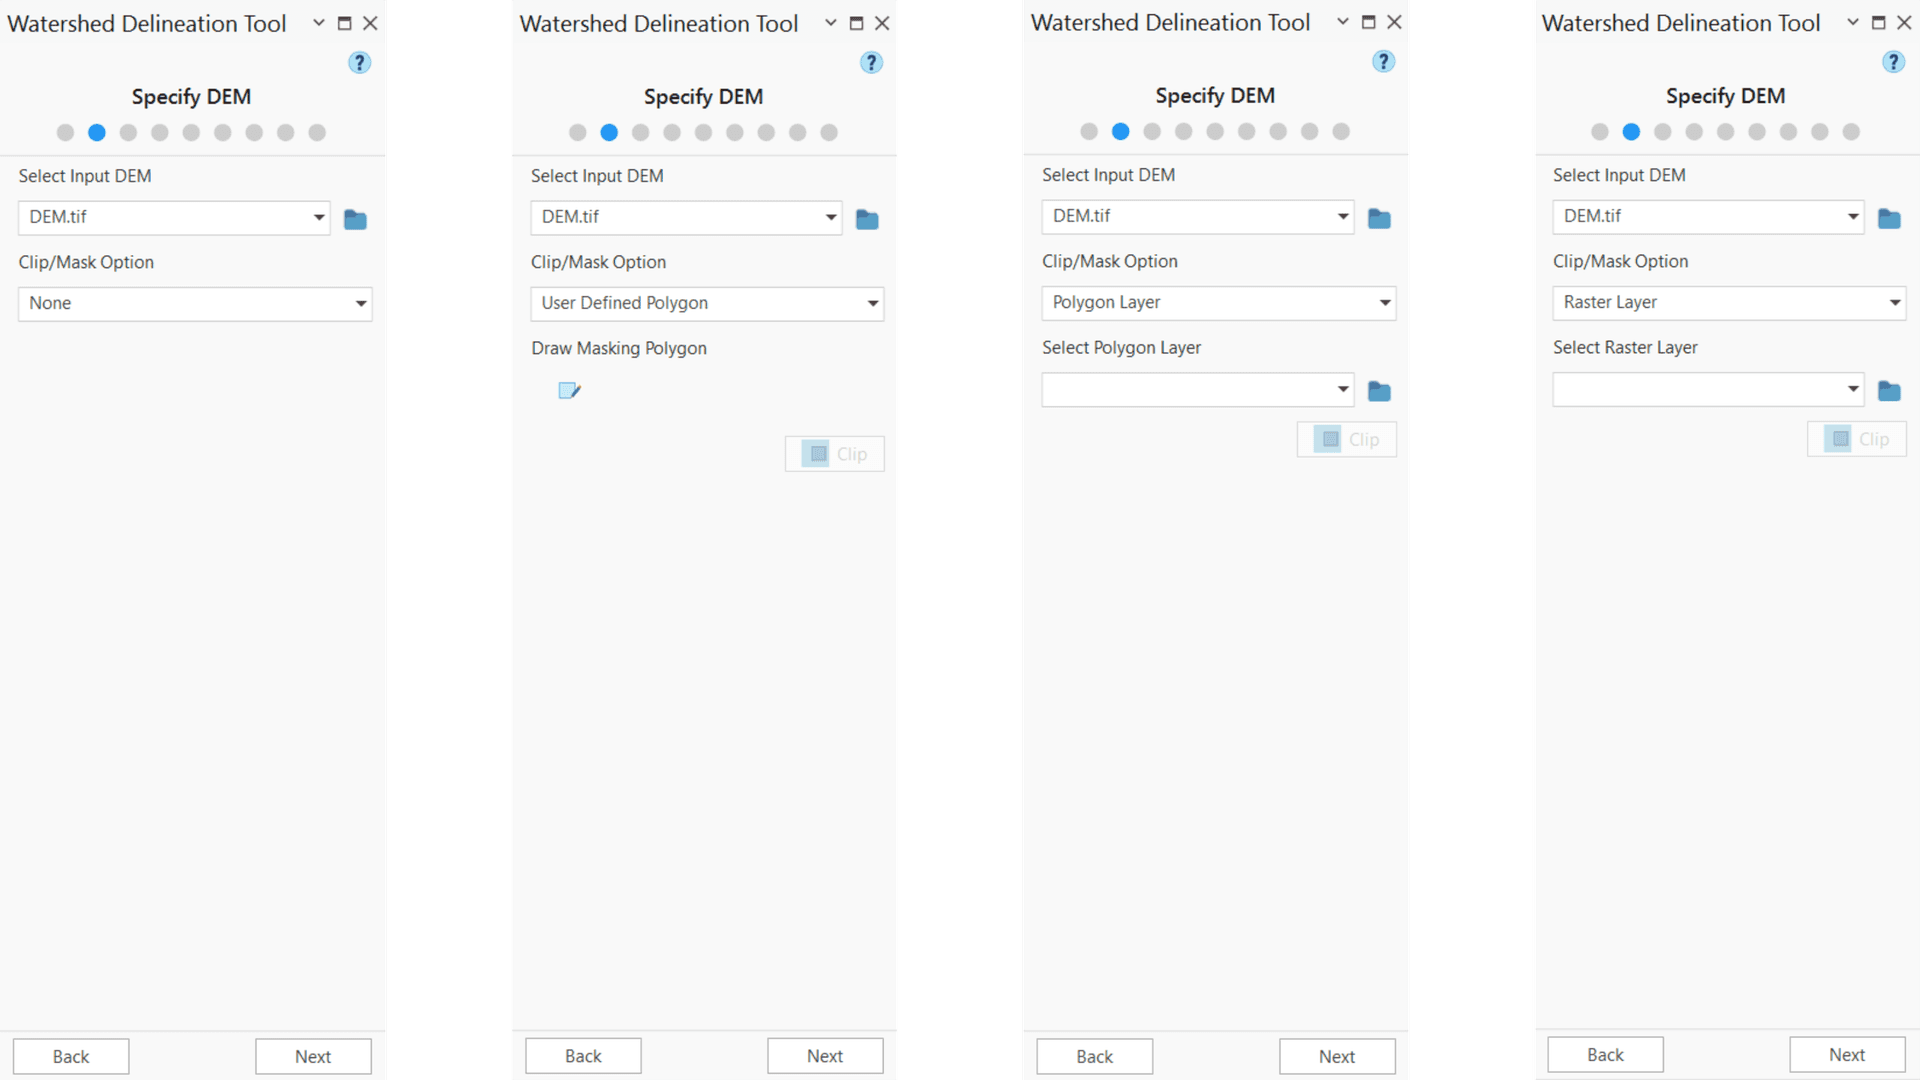
Specify DEM:
The user must provide a DEM raster representing the project area’s terrain. The input DEM should use the same coordinate system as the GeoSWMM Project to ensure accurate delineation of subcatchment boundaries.
Select Input DEM:
Choose an existing DEM from the Map or browse its file location.
Clip/ Mask Option:
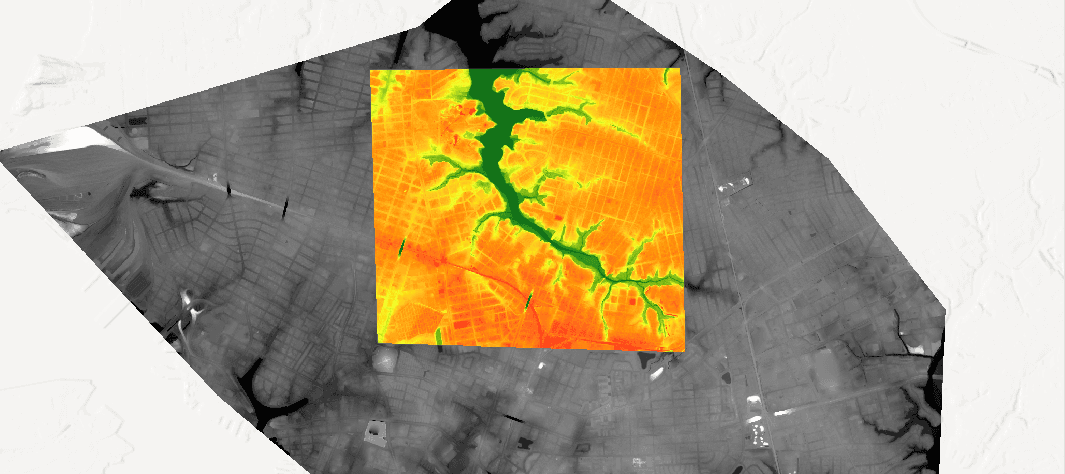
The Clip/Mask DEM option allows the user to extract only the desired portion from a large DEM dataset. If the project watershed area is relatively small compared to the full DEM data, using this option can clip/mask DEM to a smaller area, significantly reducing DEM processing time. This field is dynamic, and users can select from four available clip/mask options:
- No masking
- User Defined Polygon
- Select Polygon Feature layer
- Select Raster layer
When “No Masking” is selected, the entire DEM is used for computation. If “User Defined Polygon” is selected, the Draw Masking Polygon button (![]() ) becomes active, allowing the user to manually draw the bounding extent of the clipped DEM directly on the map. Choosing Select Polygon Feature Layer and Select Raster Layer allows users to assign the DEM boundary extent from existing polygon feature or raster layer. Finally pressing “clip” button completes the operation.
) becomes active, allowing the user to manually draw the bounding extent of the clipped DEM directly on the map. Choosing Select Polygon Feature Layer and Select Raster Layer allows users to assign the DEM boundary extent from existing polygon feature or raster layer. Finally pressing “clip” button completes the operation.
Project-Specific Inputs (optional, depending on project scope and available data):
These steps are very important for accurate watershed delineation but are considered project-specific based on data availability and modeling objectives. Users may choose to perform any of these steps or skip them as needed. If the user selects one of these options but later decides not to use it, they can simply click the ‘Next’ button to proceed without completing the input fields. If the user chooses to use any of these options, the corresponding check box must be selected. Once an option is checked, the Next button will remain disabled until all required input fields are completed, and attributes are properly assigned.
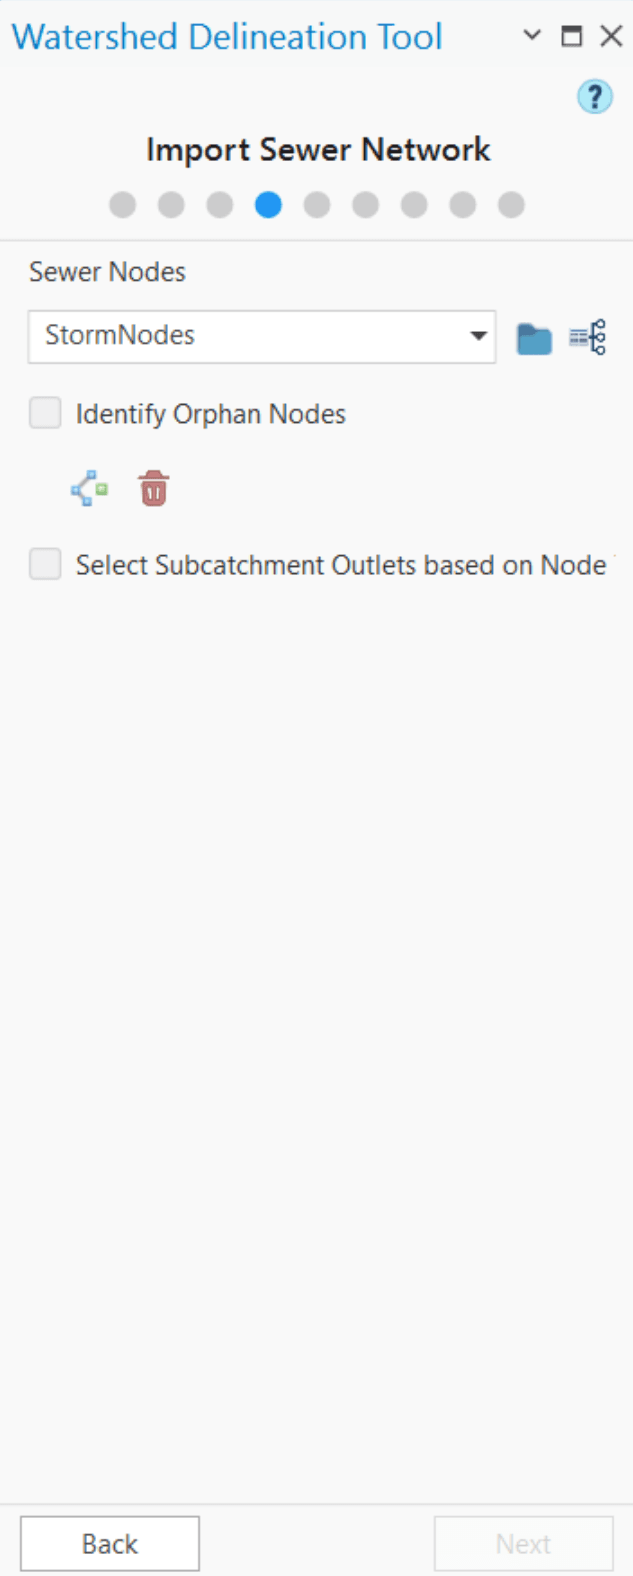
Import Sewer Network:
Import Sewer Network section enables users to import existing storm sewer network data into the Watershed Delineation tool to guide and delineate subcatchment. By importing sewer network shapefiles, GeoSWMM accounts awareness of pipe alignments, manholes, and outfalls, allowing runoff areas to be connected to the actual drainage infrastructure. To import a complete sewer network, both the sewer pipes and sewer nodes need to be imported.
Sewer Network:
Enable this option to incorporate storm sewer network analysis into the watershed delineation workflow. When it is turned on, the pipe and node datasets become available for configuration and are used during delineation process.
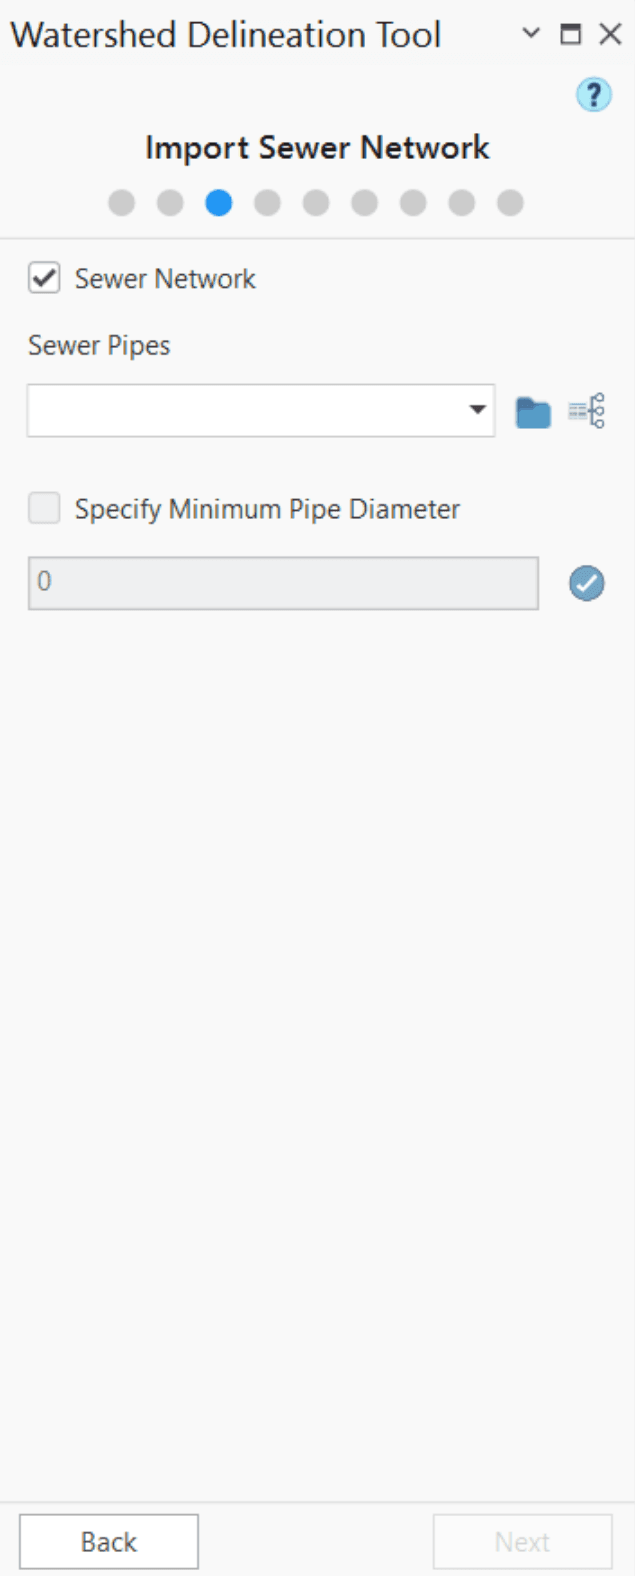
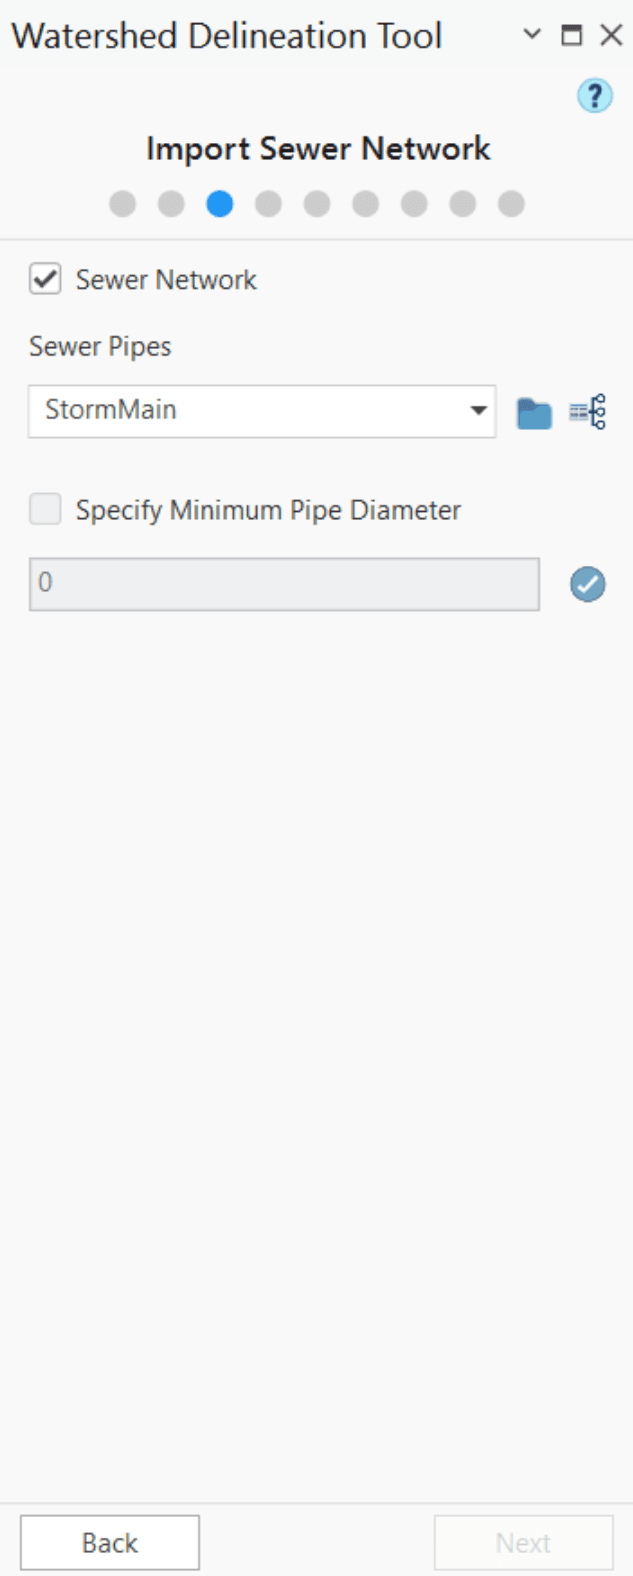
Sewer Pipes:
Provide the storm sewer pipe shapefile (polyline layer) representing the stormwater pipe network used during subcatchment delineation. Select an existing sewer pipe layer from the map or browse to its file location.
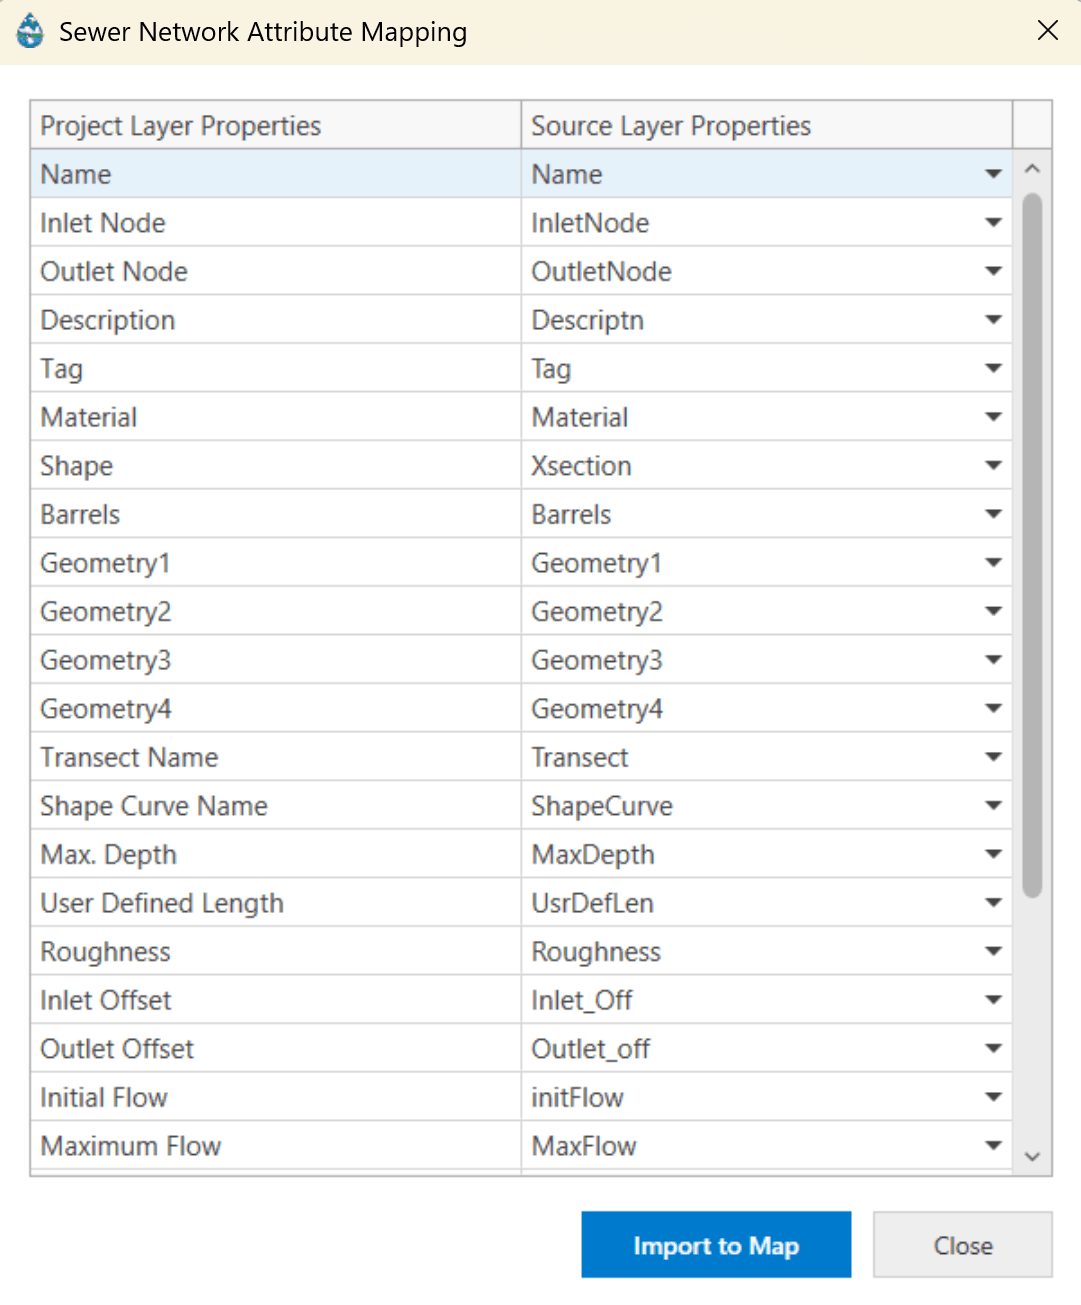
Sewer Network Attribute Mapping (pipes):
After importing the sewer pipes, click the Sewer Network Attribute Mapping (![]() ) button to map attributes from the source layer to the GeoSWMM project layer. The following fields are required and must be mapped for the tool to function correctly: Name, Inlet Node, Outlet Node, and Geometry1 (pipe diameter). Once all required fields have been assigned, click the Import to Map (
) button to map attributes from the source layer to the GeoSWMM project layer. The following fields are required and must be mapped for the tool to function correctly: Name, Inlet Node, Outlet Node, and Geometry1 (pipe diameter). Once all required fields have been assigned, click the Import to Map ( ) button to complete the mapping process.
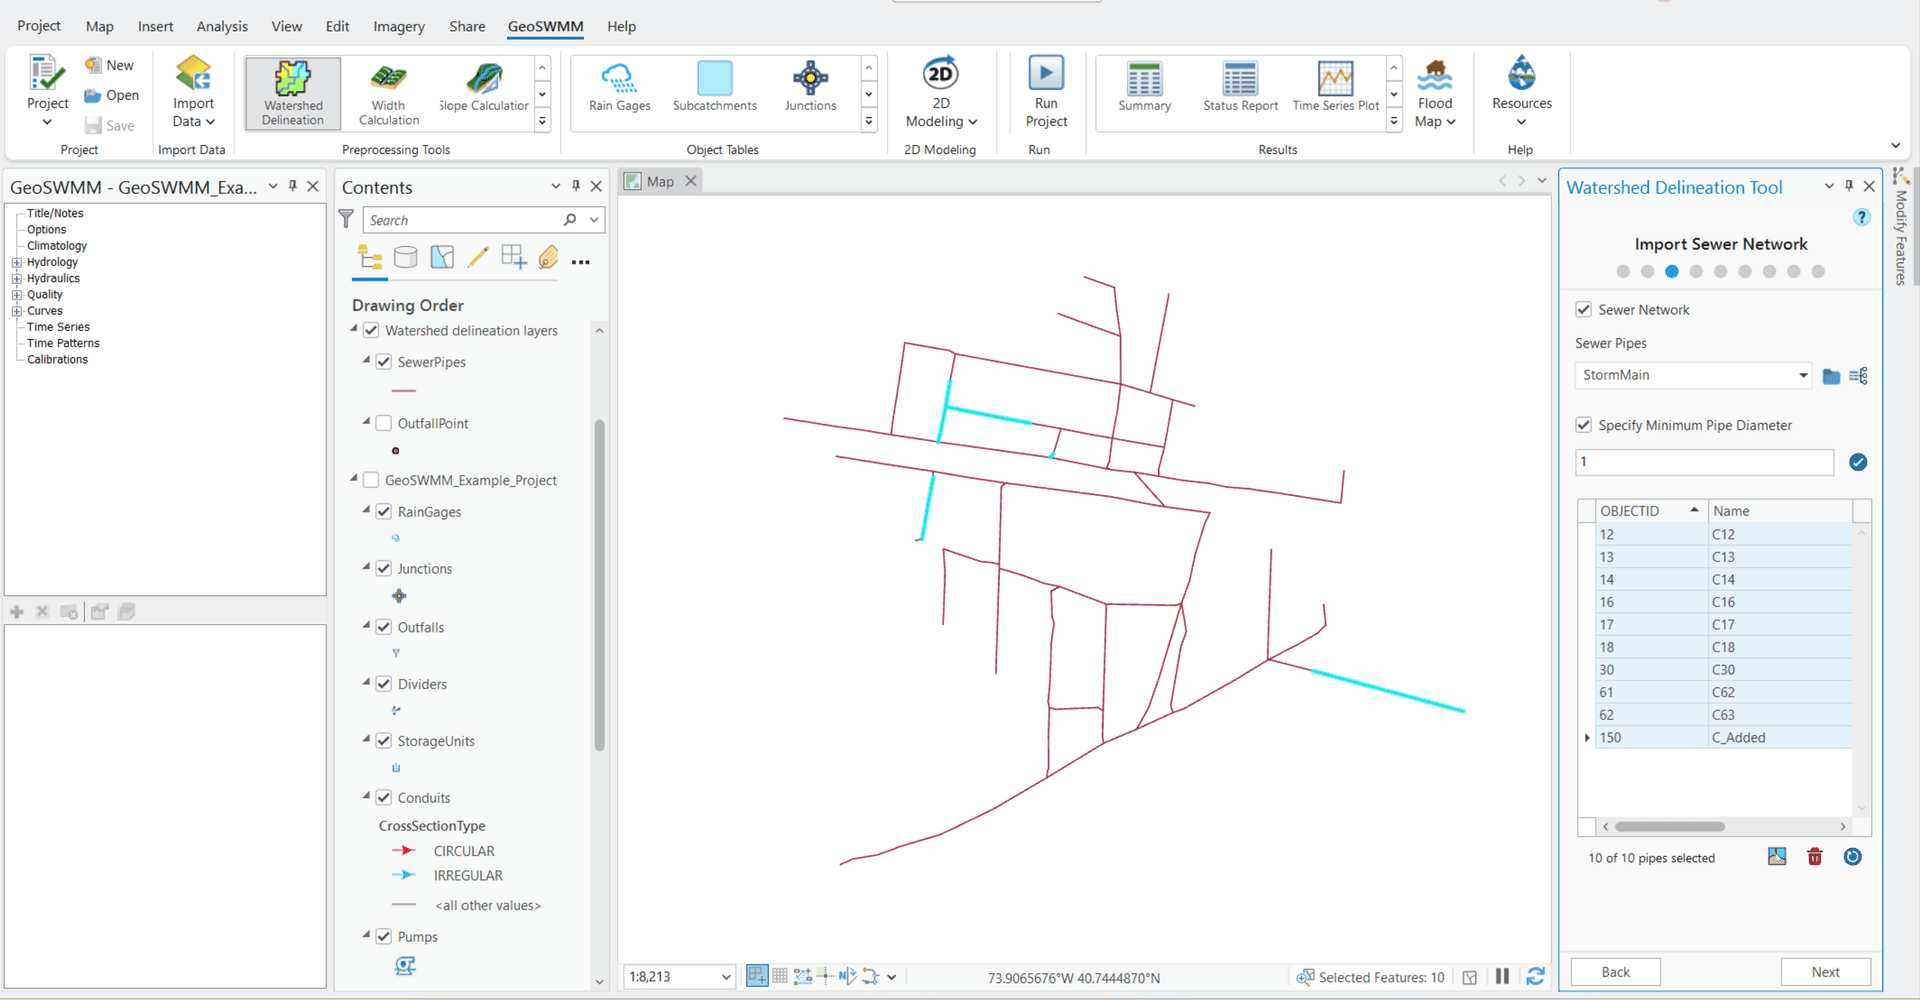
Specify Minimum Pipe Diameter:
Enter a Minimum Pipe Diameter to simplify and clean up the sewer network. This option becomes available only after all required pipe attribute fields have been mapped. Pipes with diameters smaller than the specified threshold value are identified and excluded from modeling. The identified pipes can be reviewed in both the map and the table view, allowing user to inspect and selectively remove them.
Click Apply (![]() ) to list all pipes below the specified threshold, along with their Name and Object ID, in the table. Use Select (
) to list all pipes below the specified threshold, along with their Name and Object ID, in the table. Use Select (![]() ) to highlight the listed pipes on the map, Delete (
) to highlight the listed pipes on the map, Delete (![]() ) to remove them, and Reset (
) to remove them, and Reset (![]() ) to clear the current selection and try a different diameter threshold.
) to clear the current selection and try a different diameter threshold.
Import Sewer Nodes:
Sewer nodes represent the connection points of sewer pipes, such as manholes, inlets, and outfalls. Import an existing point layer from the map or browse to its file location to add it as the sewer node layer.
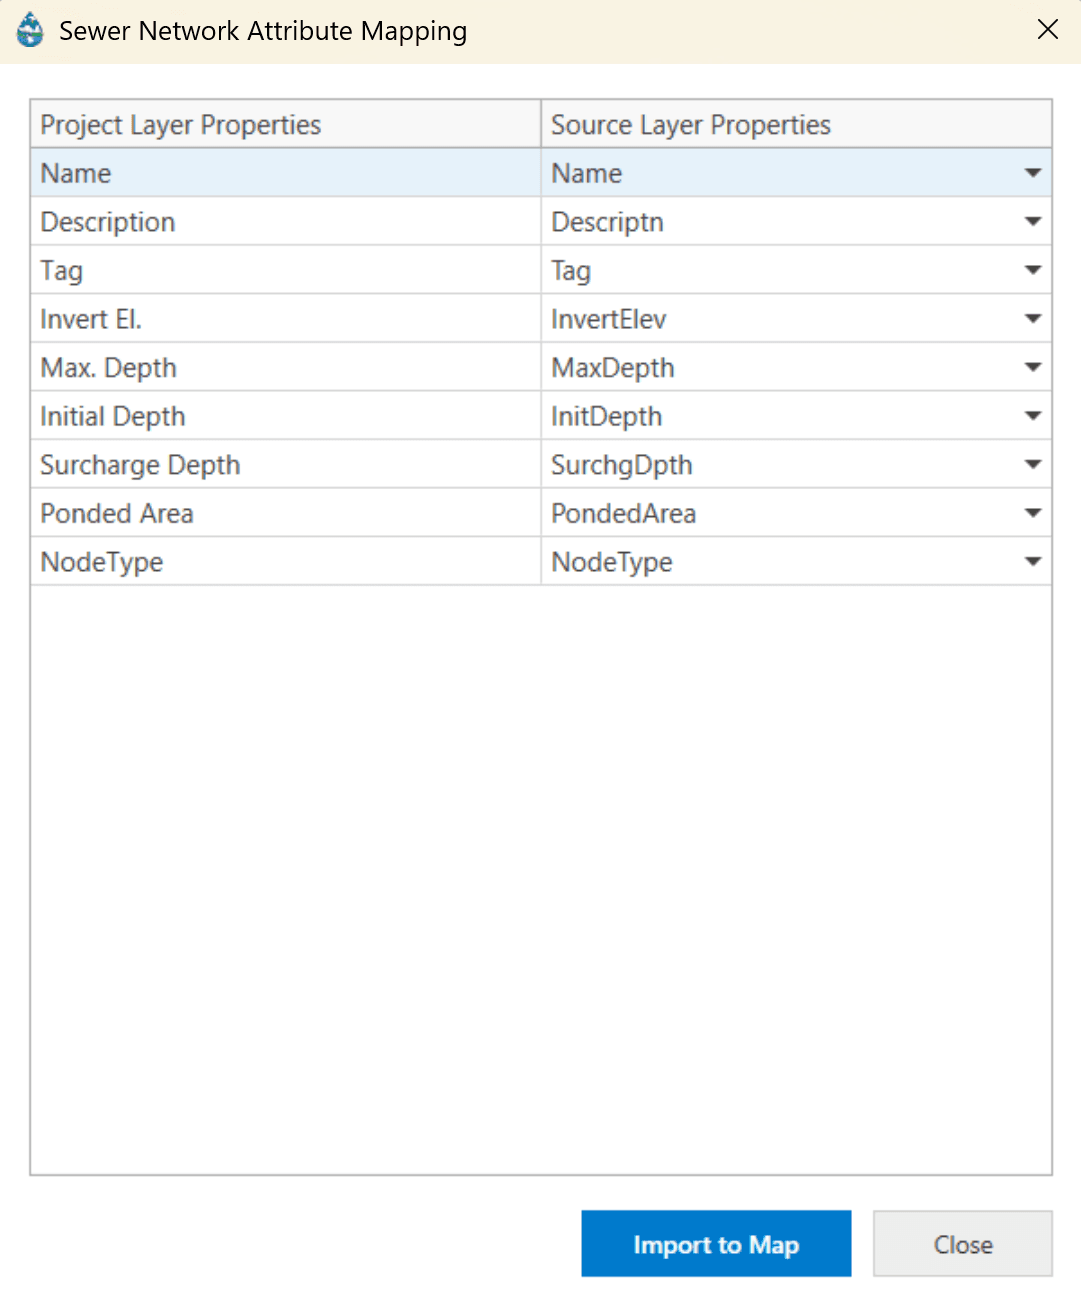
Sewer Network Attribute Mapping (nodes):
After importing the sewer node layer, click the Sewer Network Attribute Mapping ( ![]() ) button to map attributes from the source layer to the GeoSWMM project layer. The Name and Node Type fields are required and must be mapped for the tool to function correctly. Once all required fields have been assigned, click the Import to Map ( ) to complete the mapping process.
) button to map attributes from the source layer to the GeoSWMM project layer. The Name and Node Type fields are required and must be mapped for the tool to function correctly. Once all required fields have been assigned, click the Import to Map ( ) to complete the mapping process.
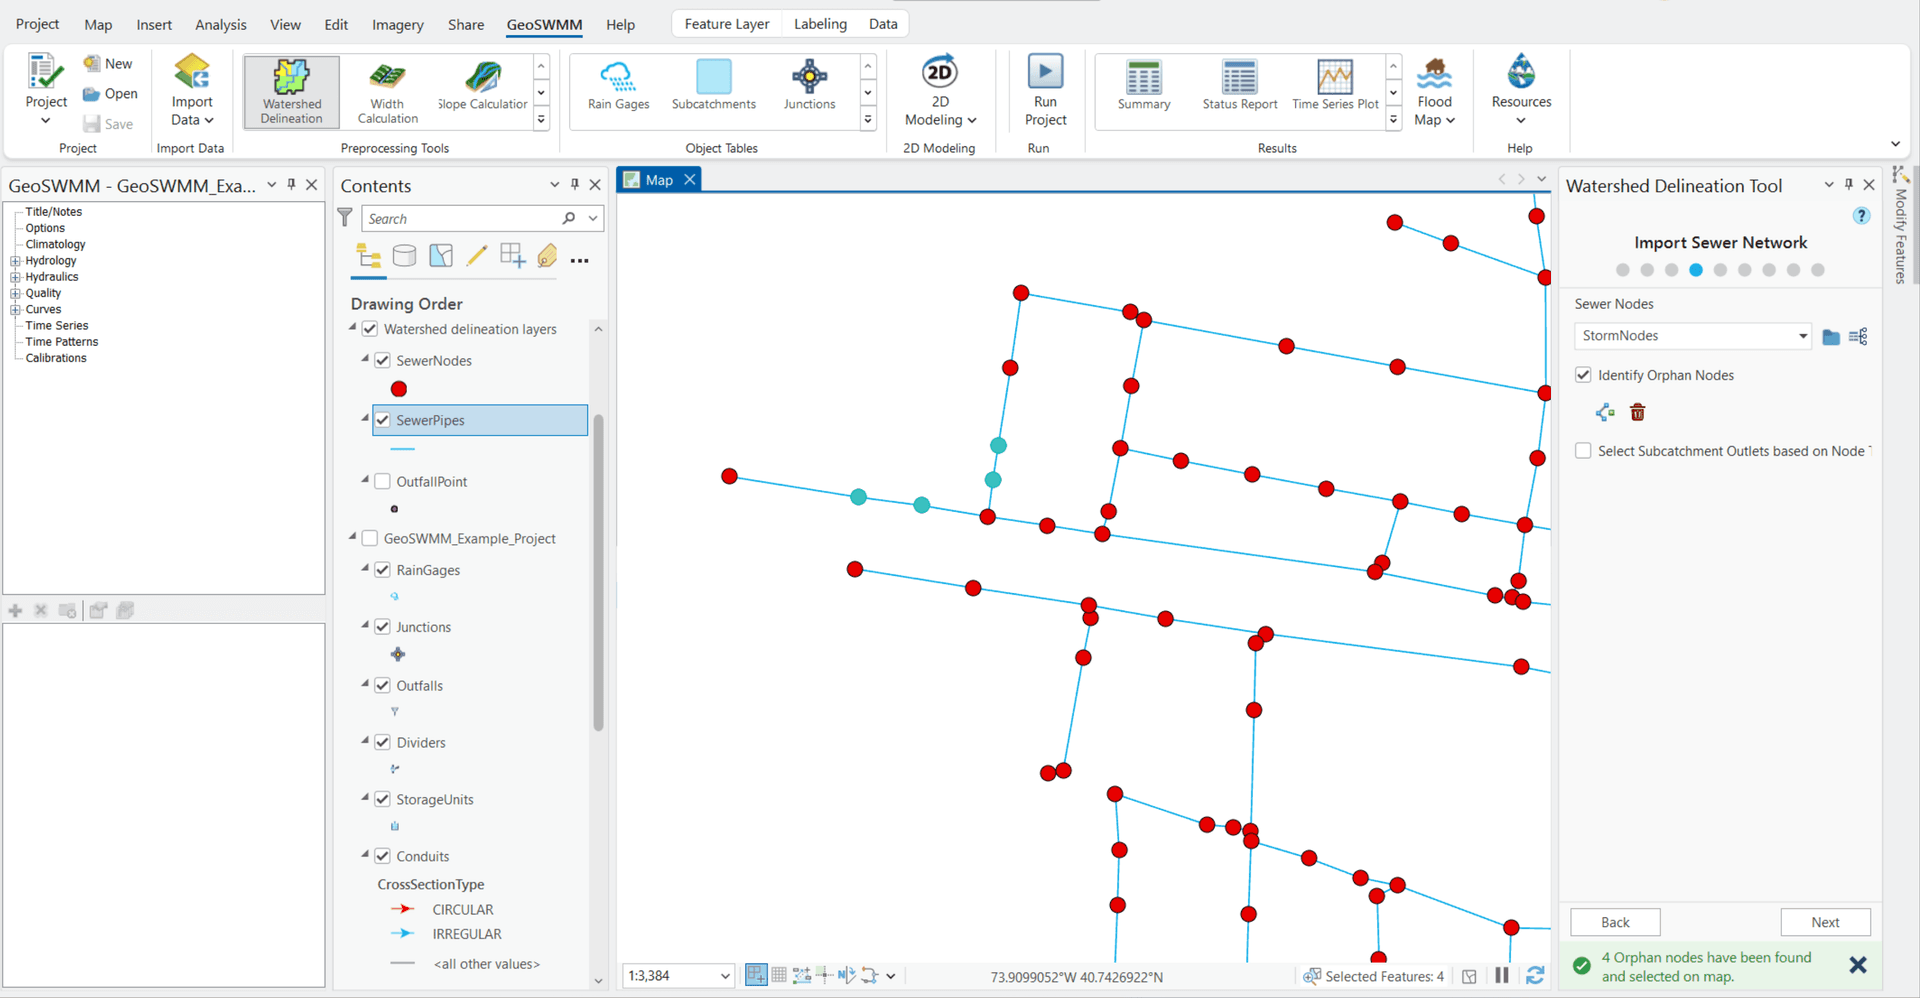
Identify Orphan Nodes:
After enabling this option, click the Find Orphan Nodes (![]() ) button to identify sewer nodes that are not connected to any sewer pipes. Identified nodes are highlighted on the map and listed in the attribute table. Use Delete (
) button to identify sewer nodes that are not connected to any sewer pipes. Identified nodes are highlighted on the map and listed in the attribute table. Use Delete (![]() ) to remove the highlighted nodes if needed.
) to remove the highlighted nodes if needed.
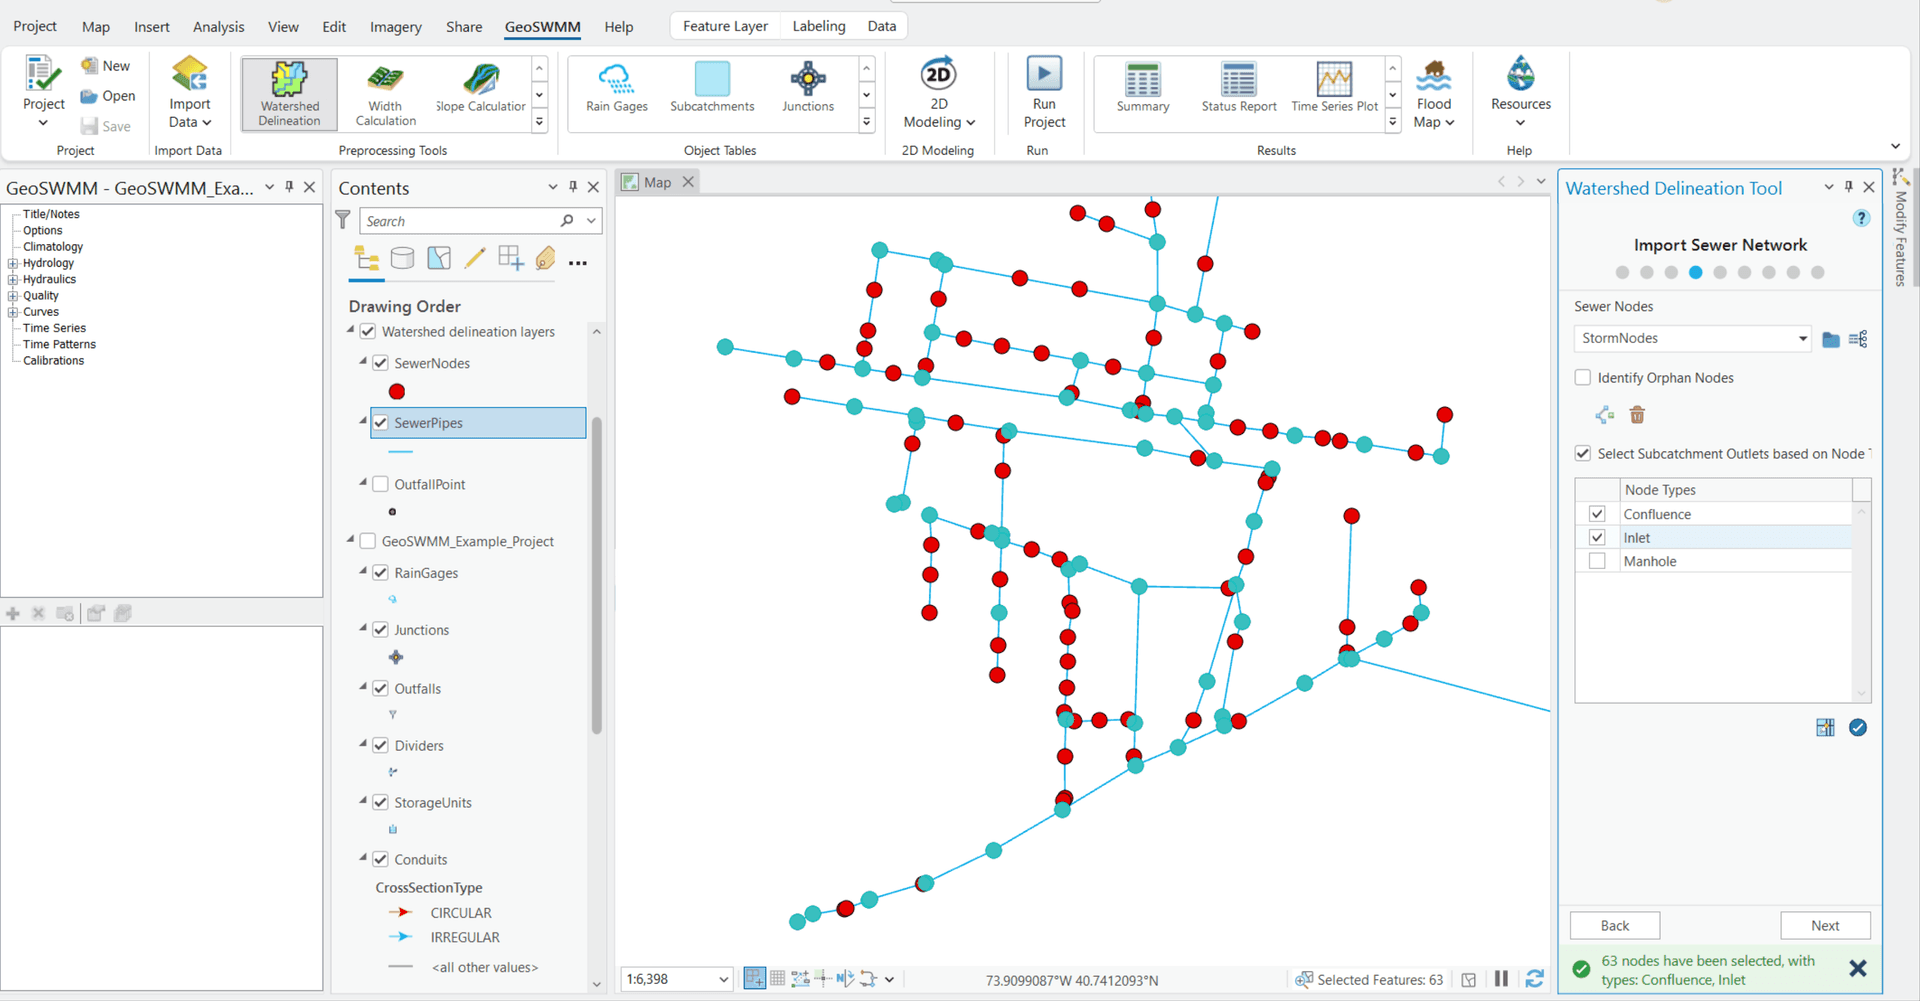
Select Subcatchment Outlets based on Node Type:
After importing the sewer nodes, users can specify which nodes will serve as subcatchment outlets for watershed delineation. Select the desired Node Type and click the Select Sewer Nodes on Map (![]() ) button to highlight all matching nodes on the map. Click Apply (
) button to highlight all matching nodes on the map. Click Apply (![]() ) to assign the highlighted nodes as outlets for which subcatchments will be delineated.
) to assign the highlighted nodes as outlets for which subcatchments will be delineated.
Import Streams:
Users can import a natural stream network as part of their watershed modeling workflow. This imported network may represent a portion of the urban drainage system. A separate file containing natural streams or open channels (e.g., Natural Stream layer) can also be used for stream burn-in during watershed delineation.
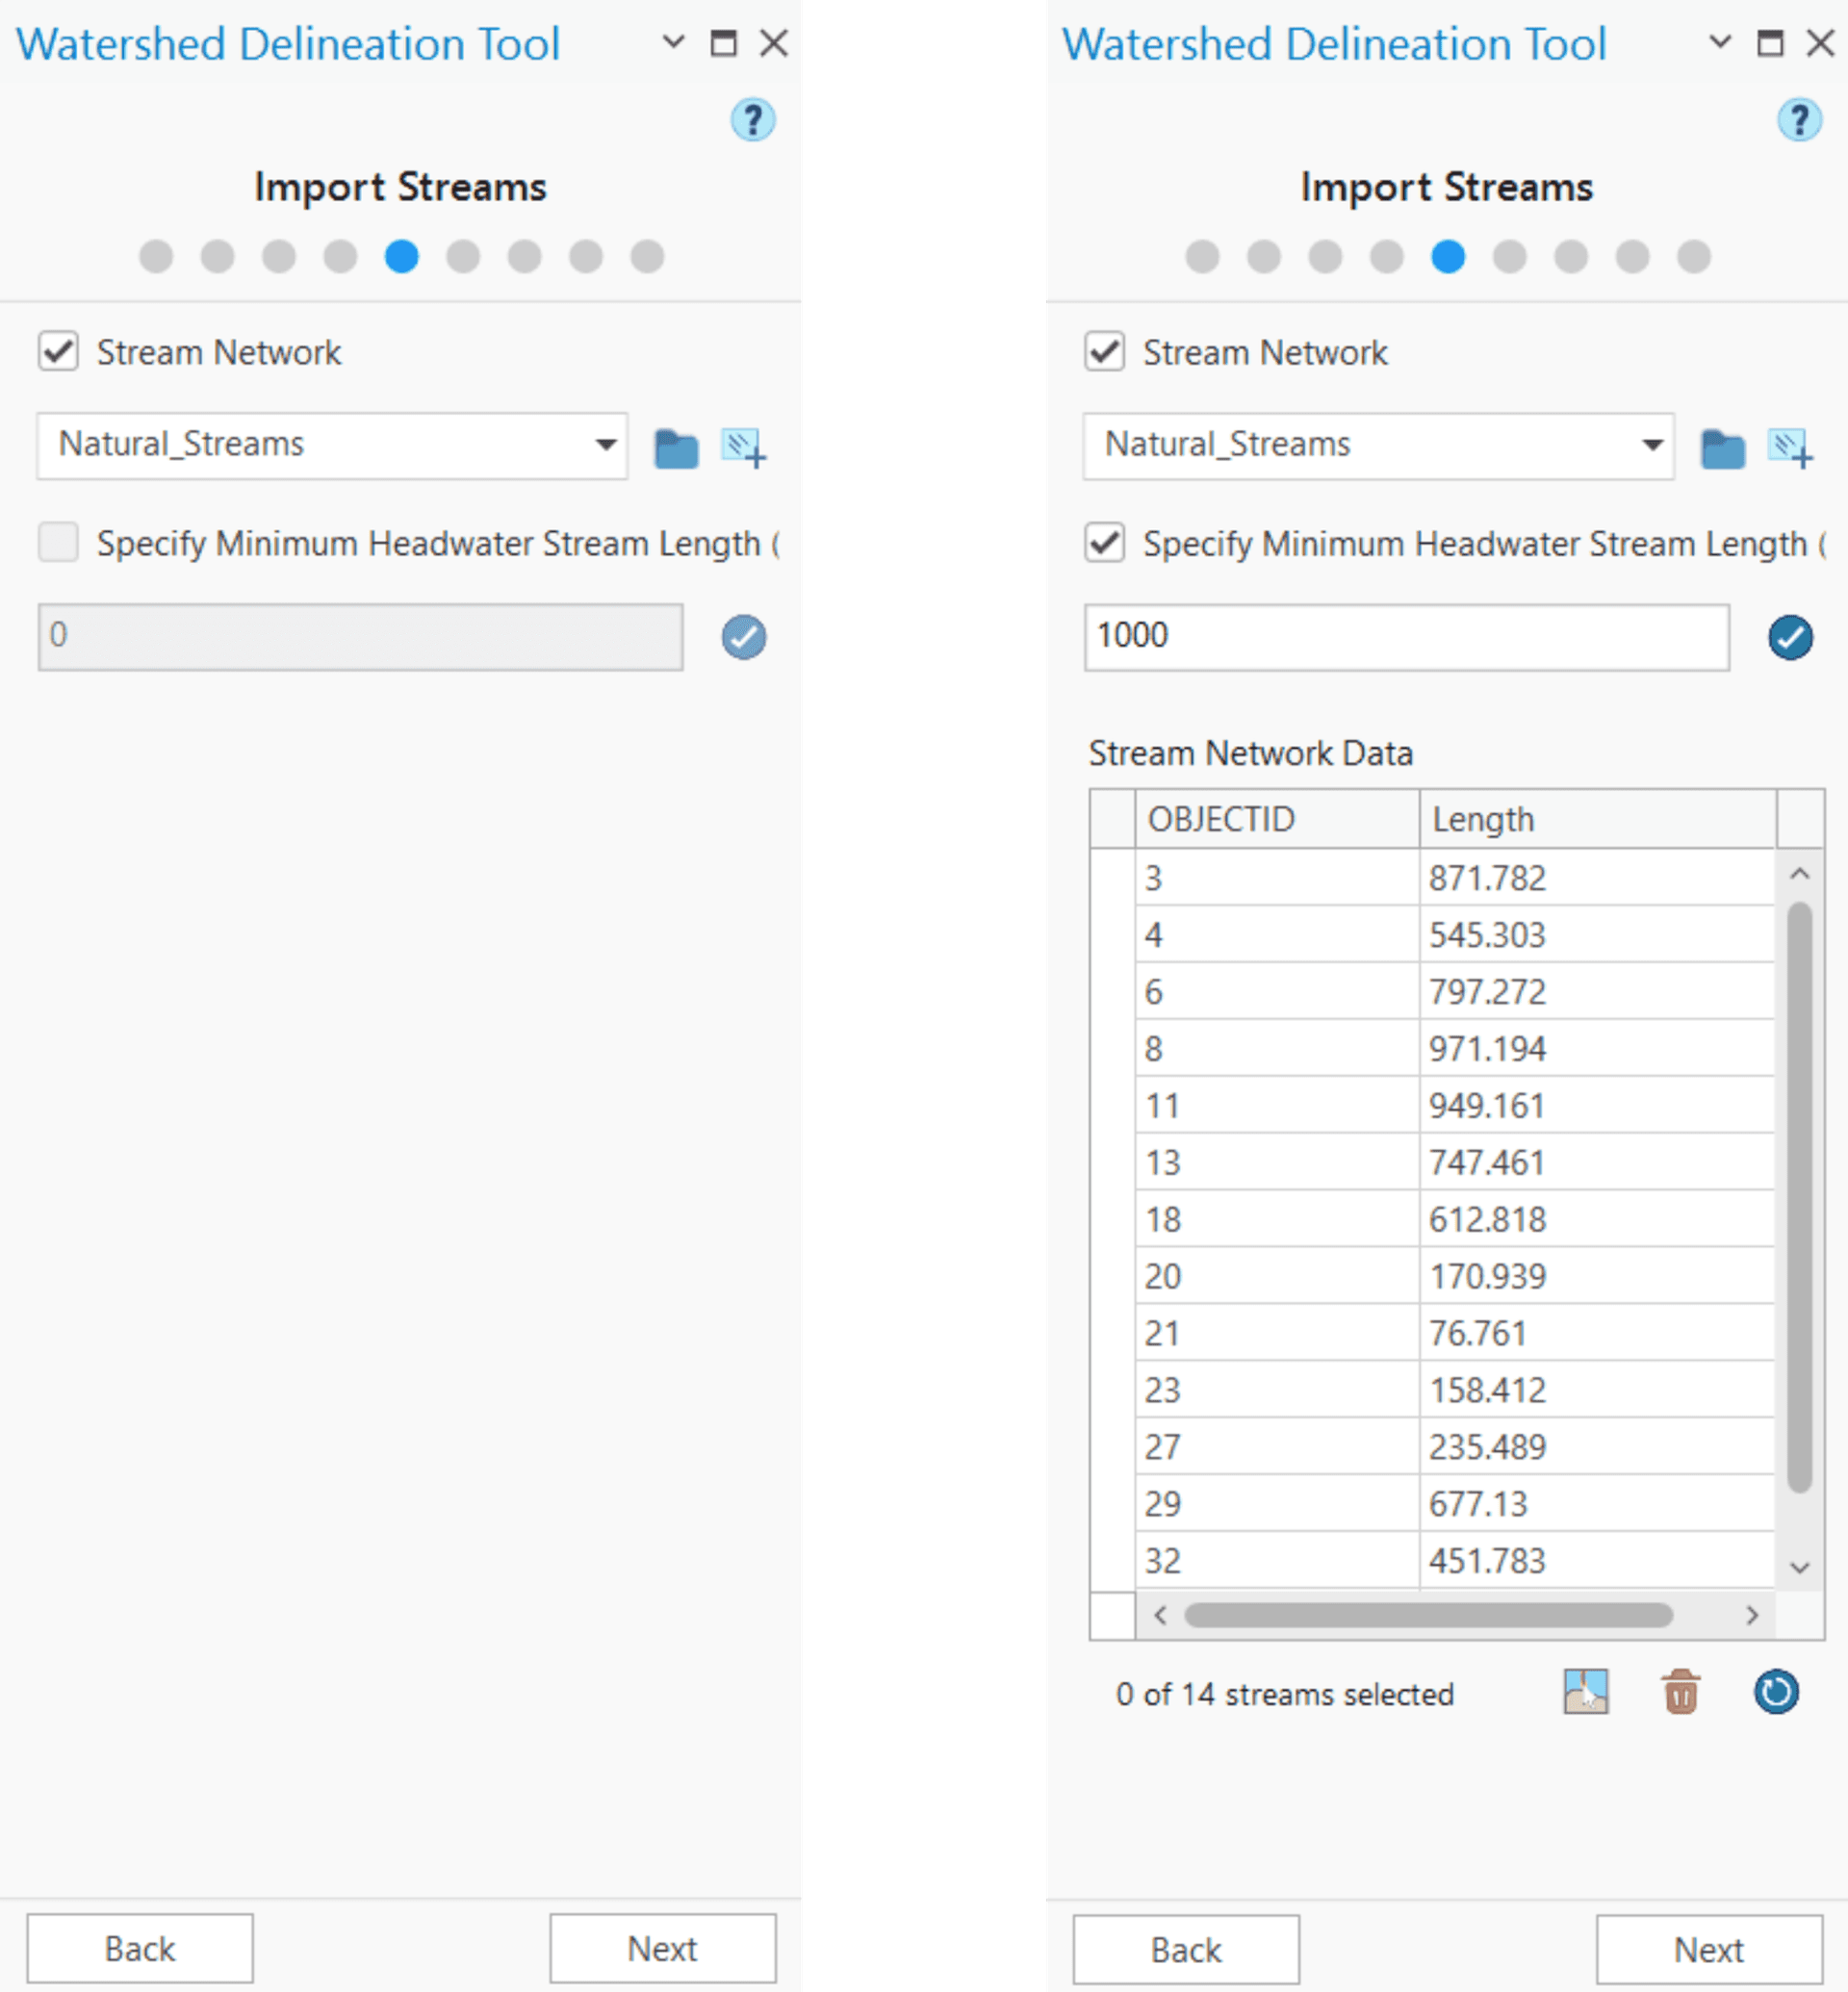
Stream Network:
This stream layer is used to enforce hydrologic flow direction (when applied for stream burn-in) and to align subcatchment boundaries with natural drainage patterns during DEM processing. The layer can be selected from map or browsed from a file path.
Define Minimum Headwater Stream Length:
Minimum Headwater Stream Length defines the shortest allowable upstream stream segment used to identify headwater channels. Stream segments shorter than this threshold are removed and excluded from modeling to simplify and clean up the watershed network. Although optional, this step improves model clarity and performance by removing minor or insignificant tributaries. Users can visualize the identified short segments on both the map and the table view, where they can review and selectively remove them. Clicking the Apply (![]() ) button lists all stream segments shorter than the defined threshold, displaying their Name, OBJECT ID, and Length in a table. The Delete (
) button lists all stream segments shorter than the defined threshold, displaying their Name, OBJECT ID, and Length in a table. The Delete (![]() ) and Reset (
) and Reset (![]() ) buttons allow users to refine and optimize the preferred minimum stream length criteria. This Select (
) buttons allow users to refine and optimize the preferred minimum stream length criteria. This Select (![]() ) button will visualize the selected shorter segments.
) button will visualize the selected shorter segments.
Stream Burn-in:
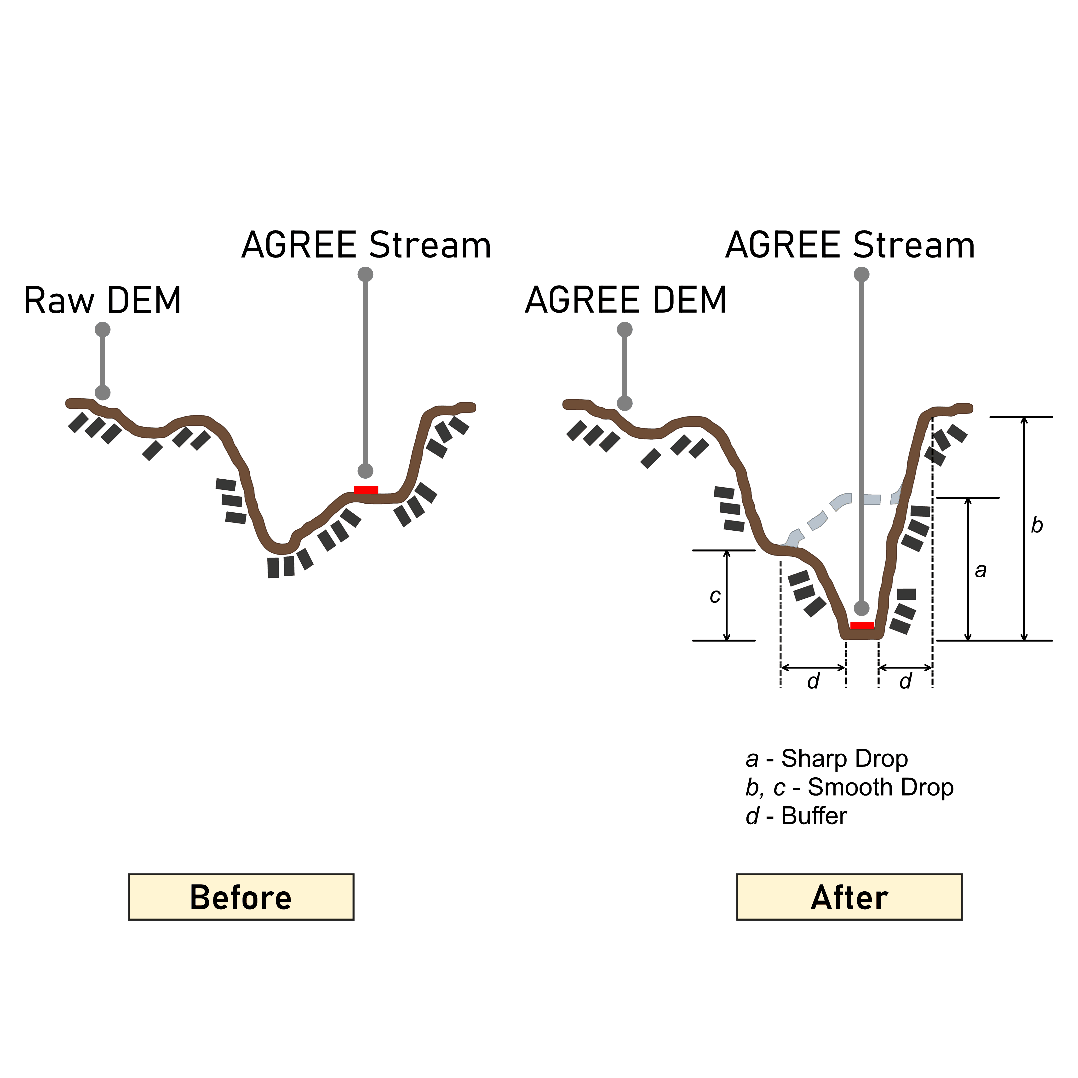
The Stream Burn-in option allows the user to prepare AGREE DEM from the input DEM by applying the "Burn-in" technique using the imported stream layer. The resulting AGREE DEM is subsequently used to generate the flow direction raster. This option is useful when users need to accurately define the major water flow path along an existing channel network (natural streams) and correct elevation inconsistencies within the DEM particularly in flat areas.
Three "Burn-in" parameters are provided-Sharp Drop (or Rise), Smooth Drop (or Rise), and Stream Buffer, each with default values. The burn-in operation primarily lowers the DEM cell elevations sharply (Sharp Drop) along the stream centerlines and applies a gradual lowering (Smooth Drop) to adjacent cells within buffer zone. This process helps ensure continuous flow paths and more realistic hydrologic behavior during watershed delineation. The burn-in technique is schematically represented in the following Figure 6.18.
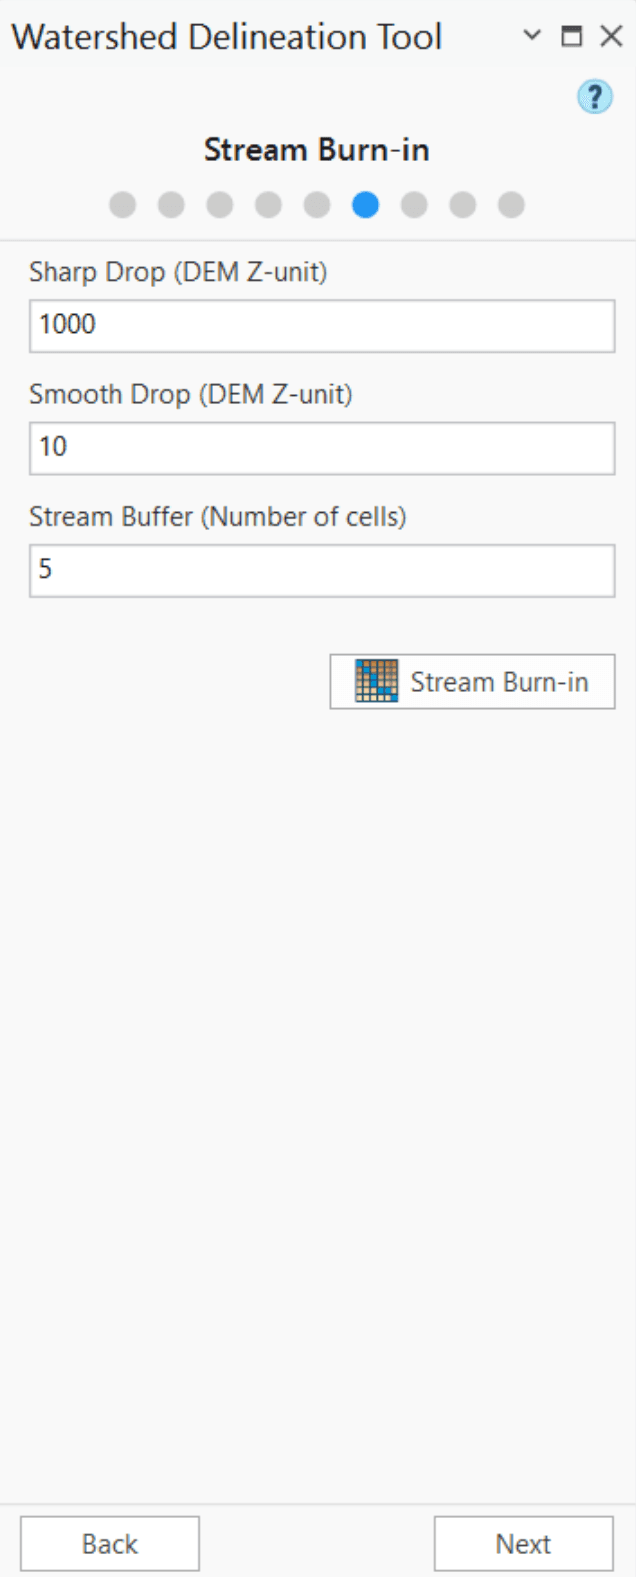
Sharp Drop: (DEM Z-unit)
Defines the abrupt lowering of DEM elevations along the streamlines to correct elevation artifacts, particularly in areas with steep terrain or artificial elevation spikes.
Smooth Drop: (DEM Z-unit)
Applies a gradual lowering (or raising) of DEM elevation values along the stream path to improve flow enforcement and maintain natural terrain transitions.
Stream Buffer:
Specifies the width of the buffer zone (in number of raster cells) around the stream network. This buffer defines the stream’s area of influence, preventing over-segmentation and ensuring smoother flow accumulation patterns.
Clicking the Stream Burn-in button completes the operation. (Fig: 6.19).
Delineate Natural Streams:
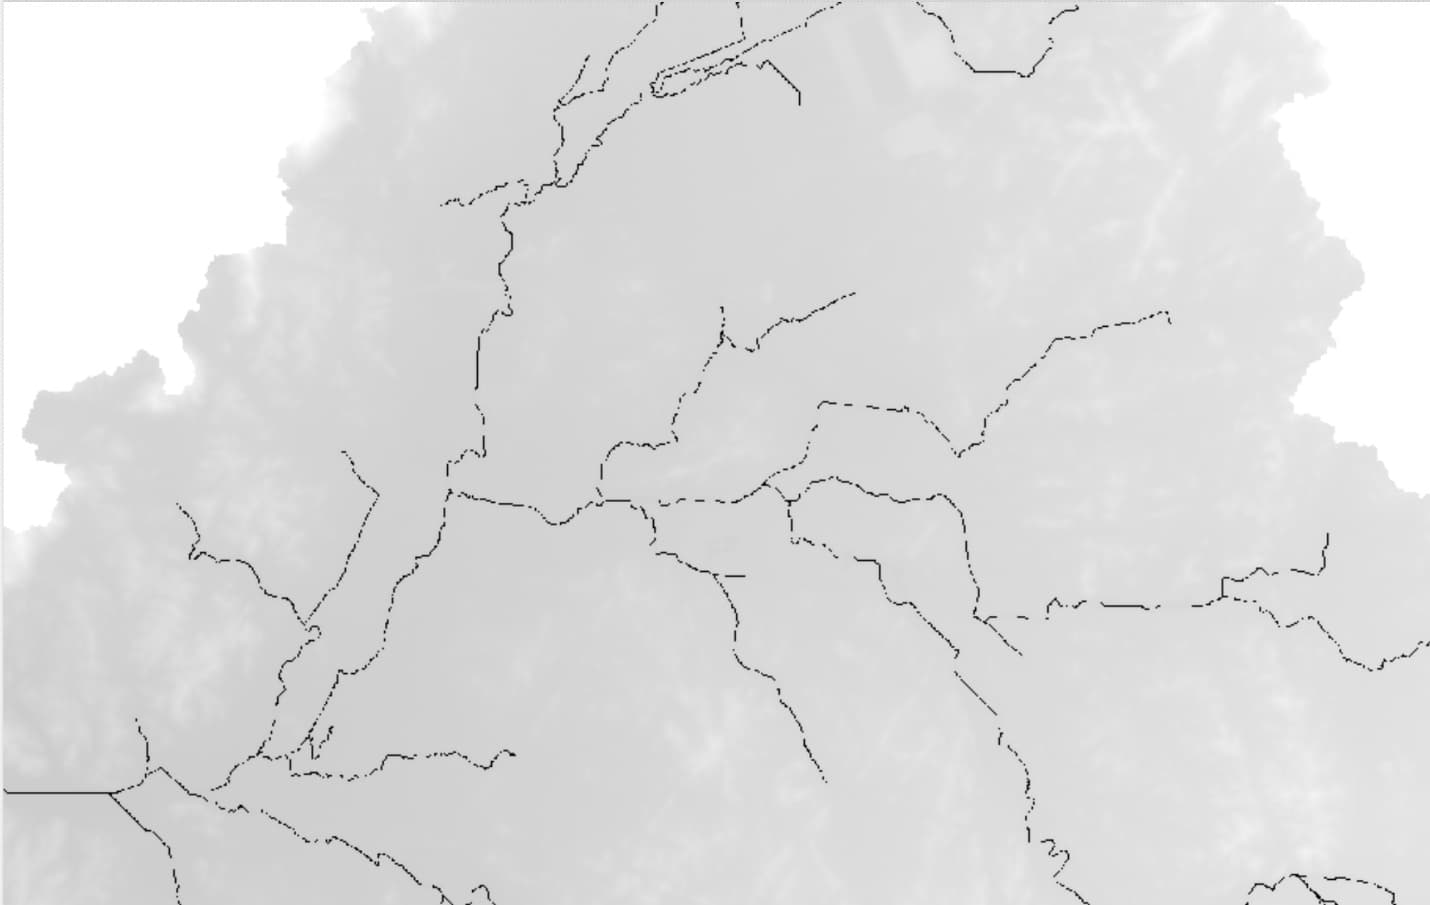
This tool allows users to generate a natural stream network within a watershed based on a specified minimum headwatershed area (minimum threshold). In a SWMM model, these delineated streams typically represent open channel conduits. The natural stream network is delineated using the minimum headwatershed area, meaning a stream originates from the outfall of each drainage area that meets or exceeds this minimum threshold. Each cell in the Flow Accumulation Raster must satisfy the threshold value to be included as part of a stream. The tool connects these qualifying cells downstream to form continuous streamlines and creates a polyline feature layer representing the delineated network, saved with a user-specified name.
After delineating the natural streams, the tool provides an additional option to refine the stream layer by defining a minimum headwater stream length. The initial stream network often includes numerous small tributaries with limited hydrologic significance. Retaining these minor channels can increase model complexity without meaningful impact on simulation results. Unless required for a specific modeling objective, these smaller tributaries can be excluded to simplify the watershed network. This refinement process allows users to identify and remove short headwater segments based on the minimum stream length criterion, updating the stream layer accordingly.
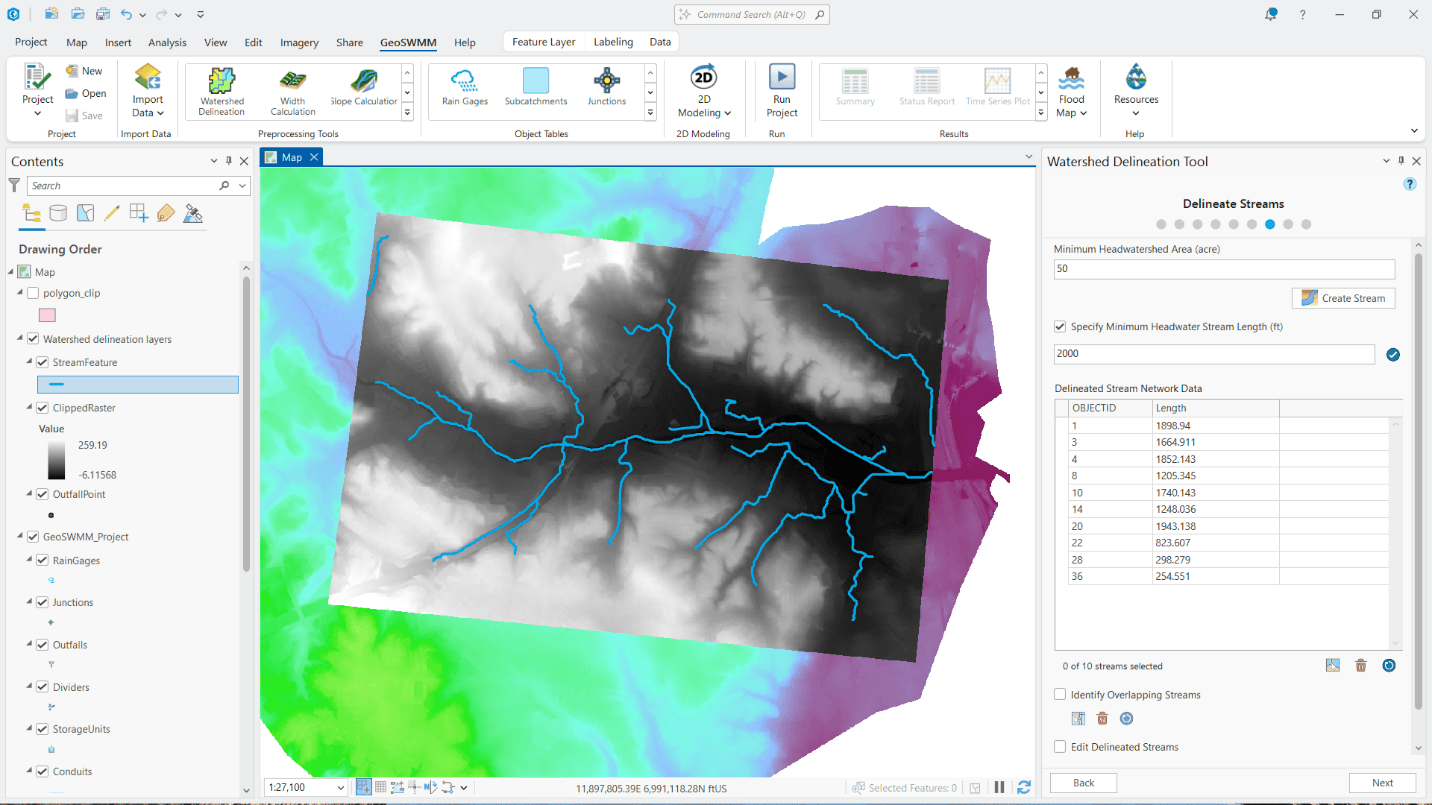
Minimum Headwatershed Area:
This parameter defines the minimum drainage area required to initiate a stream during natural stream delineation. In other words, a stream is generated from the outfall of any drainage area whose contributing area meets or exceeds this threshold. Smaller values capture fine-scale upstream branches, while larger values generalize the stream network by omitting minor tributaries. Clicking the Create Stream button completes the delineation process.
Define Minimum Headwater Stream Length:
Minimum Headwater Stream Length defines the shortest allowable upstream stream segment used to identify headwater channels. Clicking the Apply (![]() ) button displays all stream segments shorter than defined length along with their Name, OBJECT ID, and Length in a table. The Delete (
) button displays all stream segments shorter than defined length along with their Name, OBJECT ID, and Length in a table. The Delete (![]() ) and Reset (
) and Reset (![]() ) buttons allow users to refine and optimize the preferred minimum stream length criteria.
) buttons allow users to refine and optimize the preferred minimum stream length criteria.
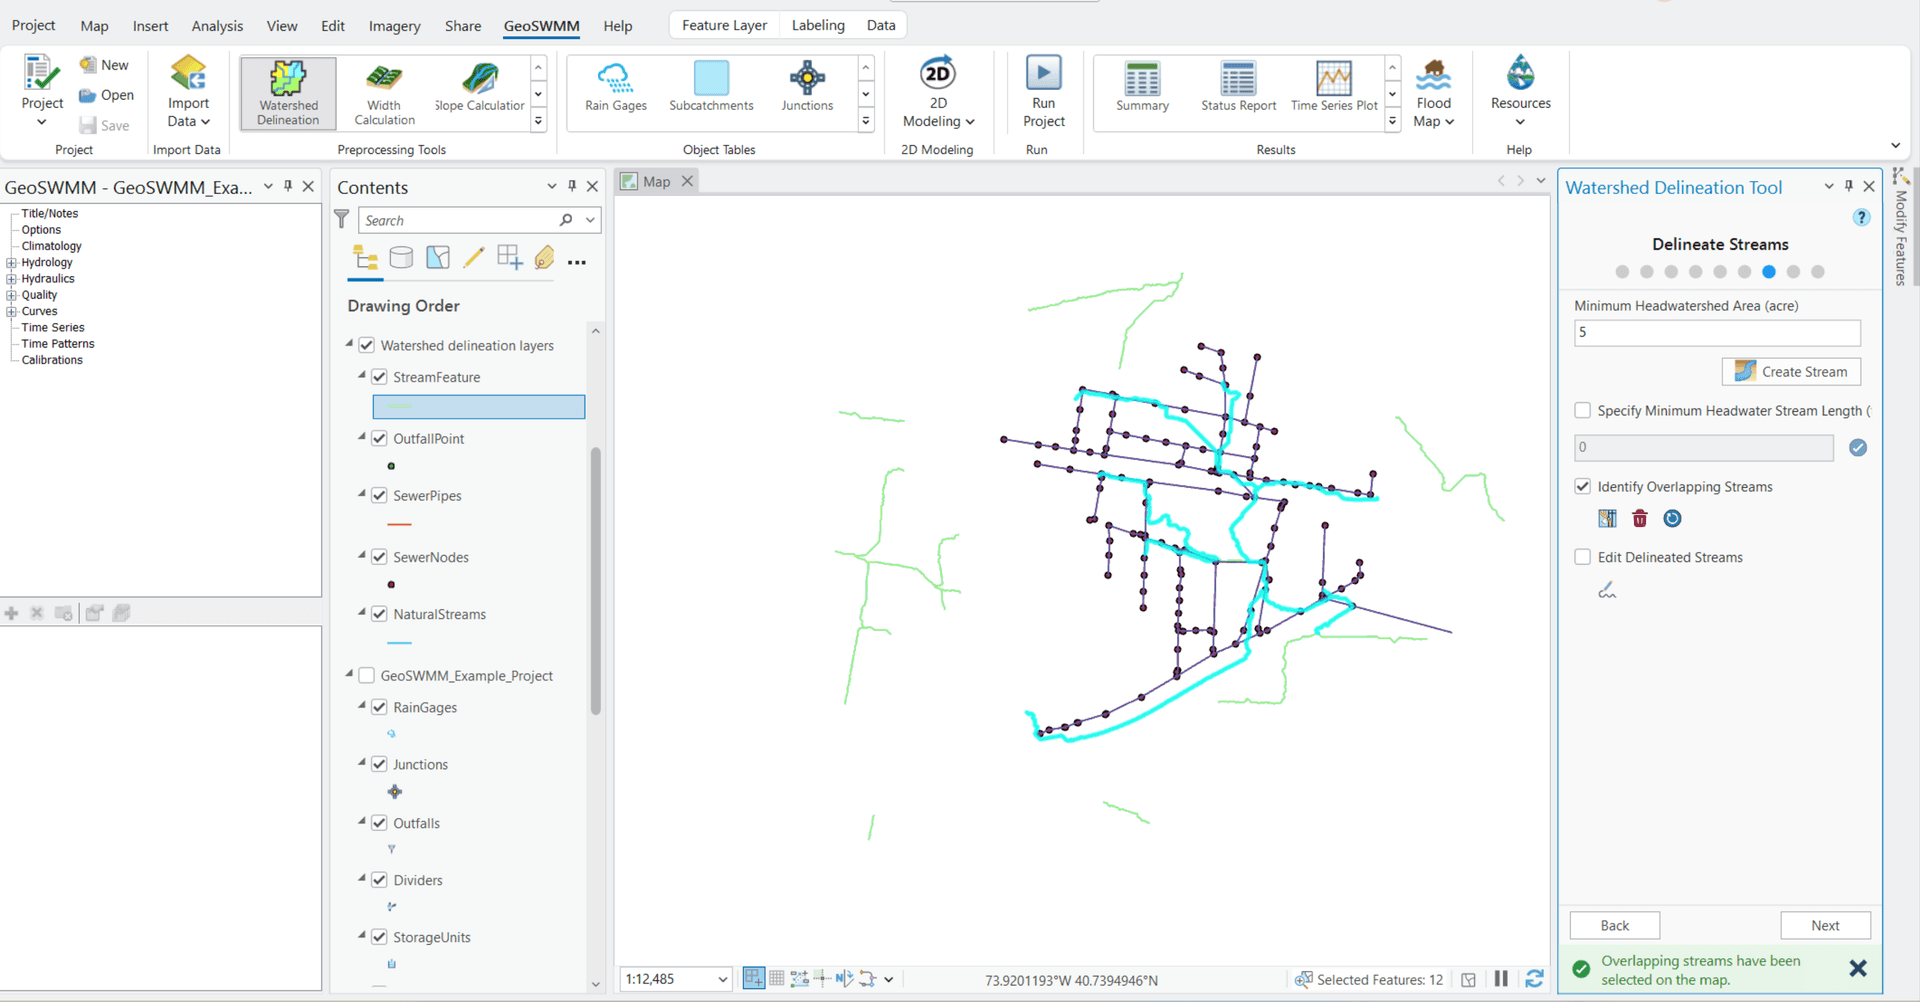
Identifying Overlapping Stream:
Enable this option to identify any delineated stream segments that overlap with existing sewer pipes. Click Identify Overlapping Streams (![]() ) to detect and highlight natural stream segments that overlap sewer pipes or pass through sewer nodes. Use Delete (
) to detect and highlight natural stream segments that overlap sewer pipes or pass through sewer nodes. Use Delete (![]() ) to remove unwanted stream segments with a single click, or Reset (
) to remove unwanted stream segments with a single click, or Reset (![]() ) to clear the selection and refine the results.
) to clear the selection and refine the results.
Note: If a generated stream intersects an existing sewer node, the stream is automatically split at that node, and no additional outlet is created at that location during conduit outlet generation.
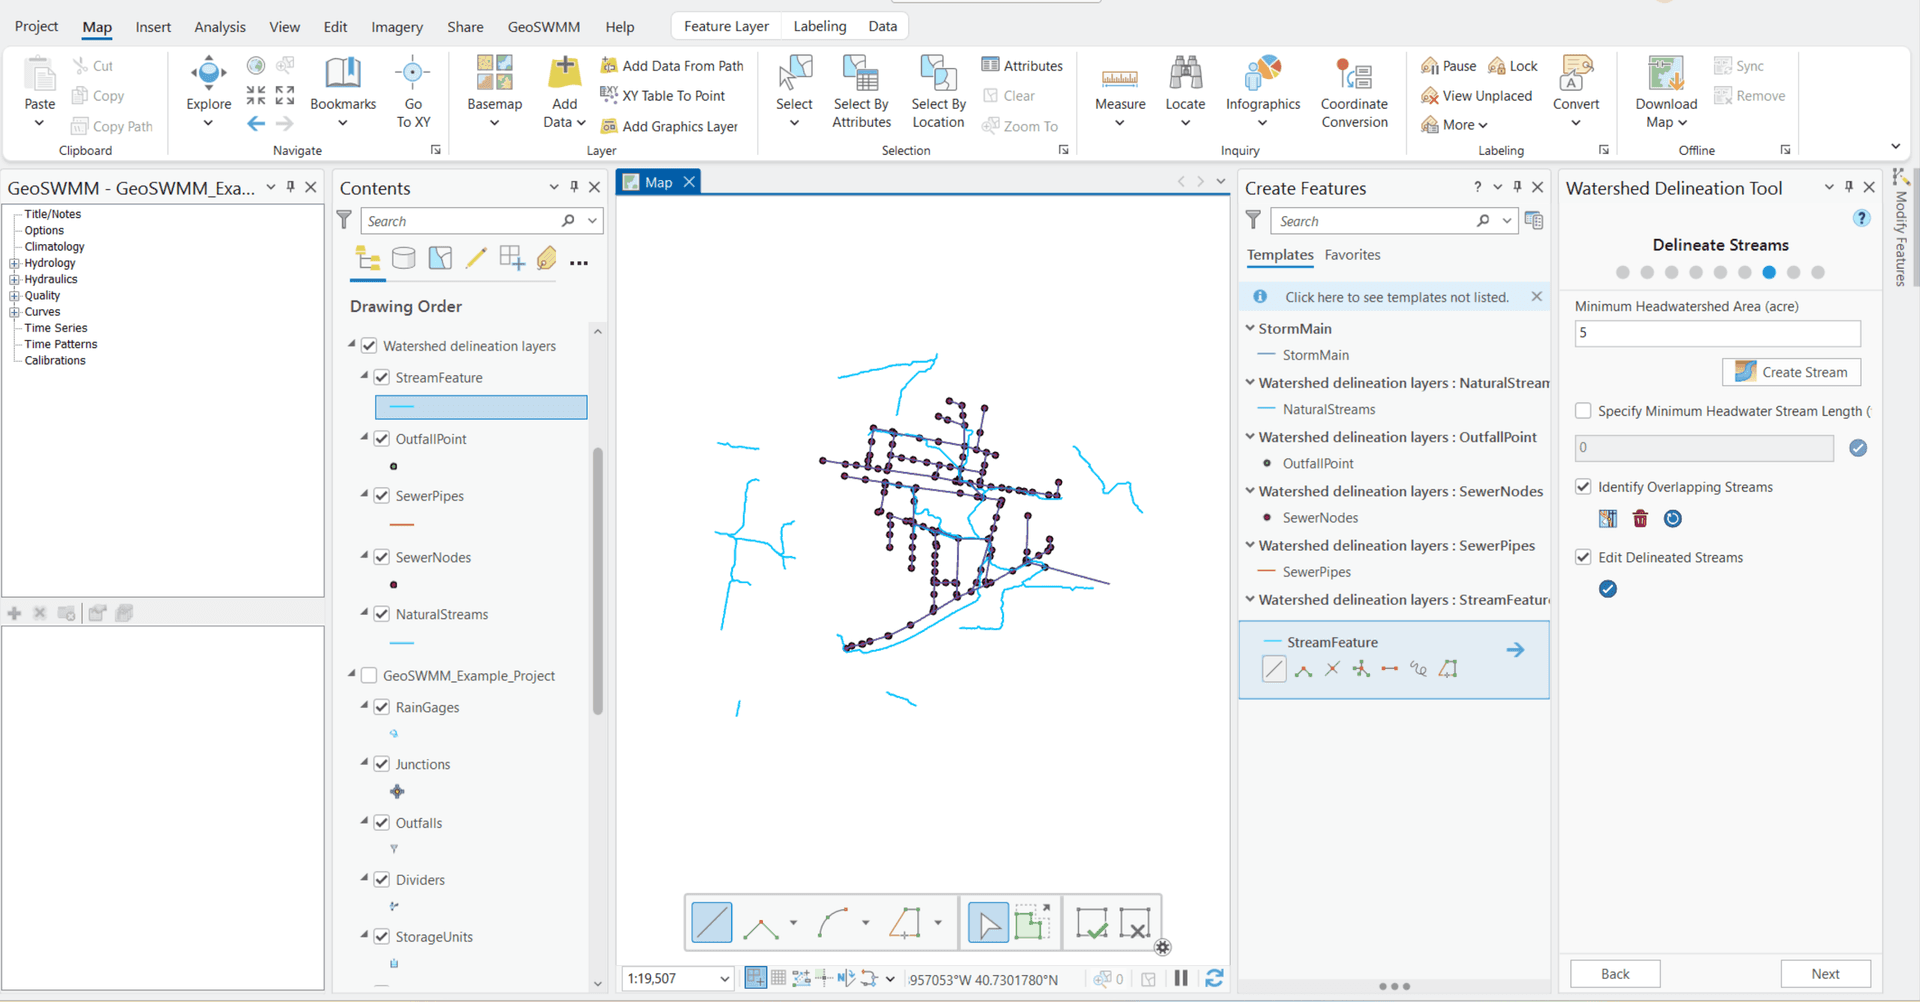
Edit Delineated Streams:
In some cases, users may need to remove or modify delineated stream segments that are not intended to be included in the model. Click Edit Delineated Streams (![]() ) to open the ArcGIS Pro Editor, and edit the delineated stream features as needed. Click Apply (
) to open the ArcGIS Pro Editor, and edit the delineated stream features as needed. Click Apply (![]() ) to save the changes.
) to save the changes.
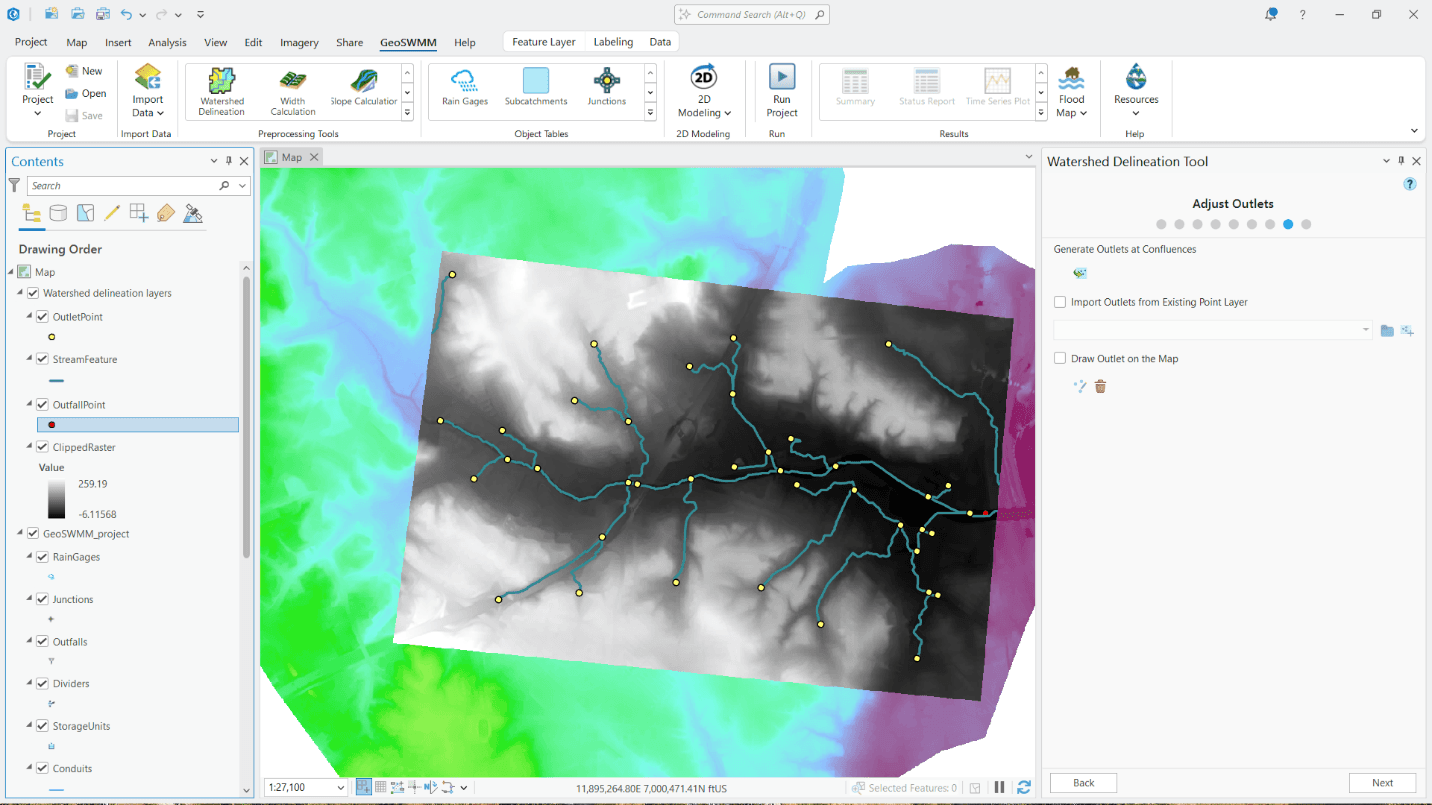
Adjust Outlets
The Adjust Outlets option allows users to specify outlet points and delineate subcatchment boundaries for those locations. The Watershed Delineation Tool provides three options for defining outlets:
- Generate outlets at stream confluences.
- Import outlets from an existing point layer
- Draw outlets on the map.
Generate Outlets at Confluences:
This option identifies and generates outlet nodes at junctions where multiple upstream drainage paths meet (i.e., confluences) within a subcatchment or watershed. A single outlet is created at each confluence for every headstream. Clicking the Generate Outlet button (![]() ) completes the operation.
) completes the operation.
Import Outlets from an Existing Point Layer:
This option allows users to select an existing point layer (e.g., flow gage locations for calibration. Bridge/culvert locations) as the target for watershed delineation. These points act as downstream endpoints for watershed boundary generation. The Add (![]() ) and Delete (
) and Delete (![]() ) button are available to add or delete the selected point layers.
) button are available to add or delete the selected point layers.
Draw outlets on the Map:
This option allows users to manually define watershed outlets by drawing points directly on the map. In addition to other outlet points, the tool delineates subcatchments for these user-defined points using the underlying DEM and flow direction data. The Draw Outlet (![]() ) and Delete Outlet (
) and Delete Outlet (![]() ) button assist in creating or removing outlet points.
) button assist in creating or removing outlet points.
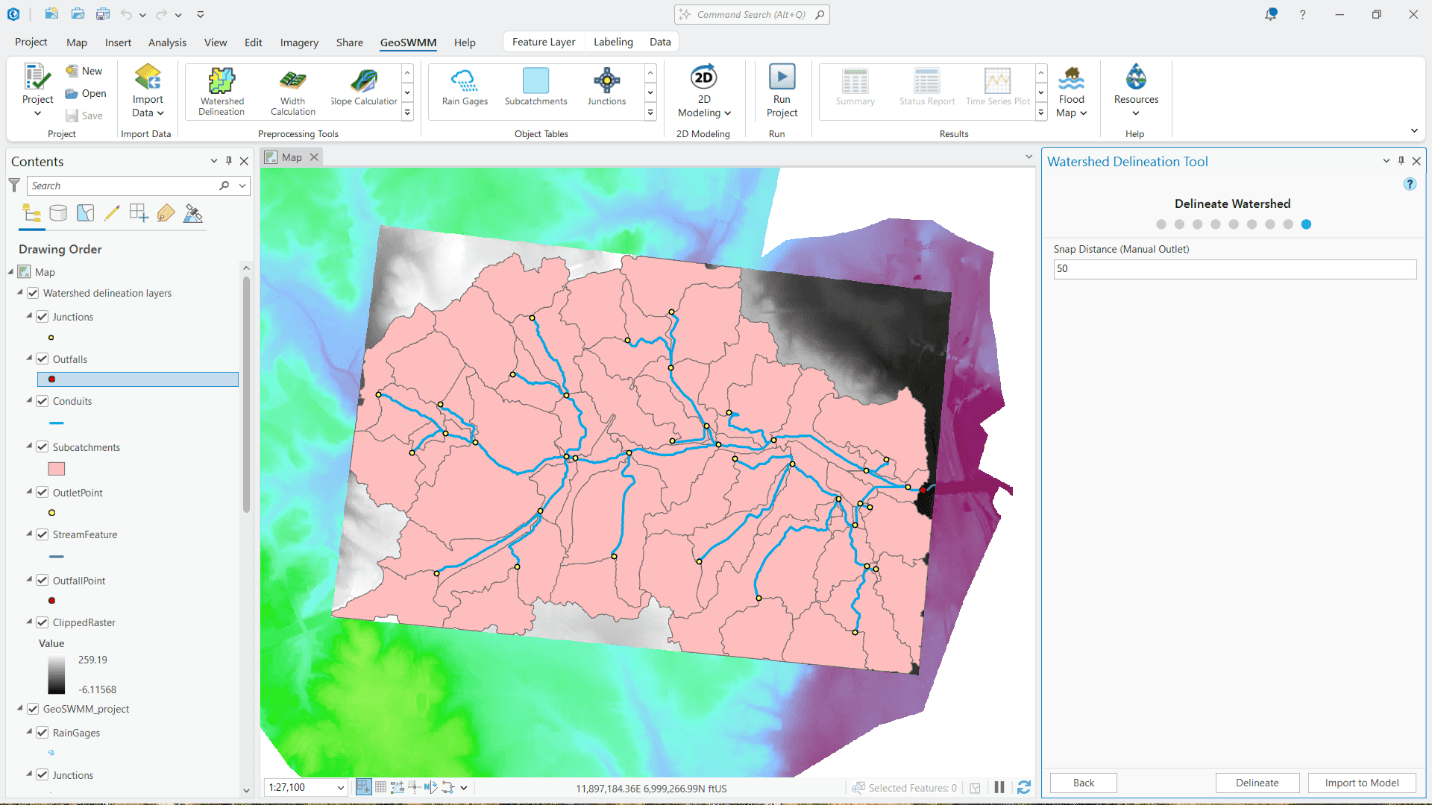
Delineate Watershed
In this section, users can delineate the watershed for project outfalls, sewer nodes, outlets, and existing outlets (including manually added ones). Before running the delineation, users can optionally configure snapping settings for manual outlets.
Outlet snapping configuration
This setting specifies how manually defined outlet points are snapped to the nearest drainage line during watershed delineation to ensure accurate hydrologic flow routing. By default, the Snap Distance for manual outlets is set to 50.
After configuring the settings, clicking the Delineate button generates a polygon layer representing the delineated subcatchment boundaries. A Cancel (![]() ) button is available to stop the delineation process at any time.
) button is available to stop the delineation process at any time.
Once the delineation is complete, clicking the Import to Model button allows users to import the watershed, natural streams, Storm Sewer Network, Outlets, and Outfalls into their corresponding layers- Subcatchment, Conduit, Junction, and Outfall-within the GeoSWMM model.