Add a Rainfall Time Series
Time series are treated as non-visual objects in GeoSWMM. Rainfall data in a GeoSWMM model is represented as one type of time series data, and the time series is linked with a model rain gage. In this example, a simple rainfall time series will be created for the rain gage RG-1. To do so:
-
Select Time Series in the Model Object Panel and click on the Add (
) button to open the time series data editor.
-
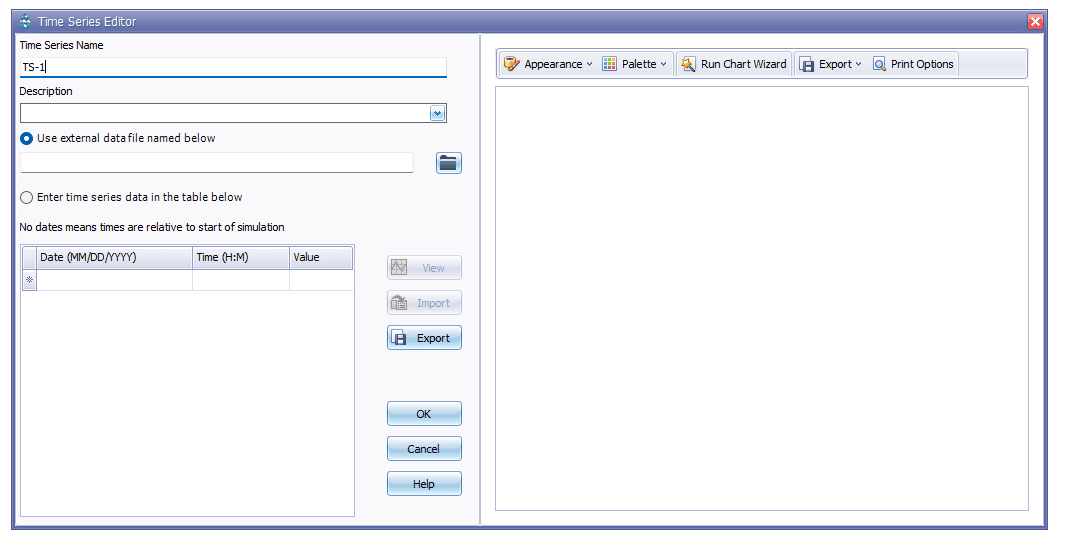
Insert the time series name- TS-1. You can insert the data directly in the editor or can import from or use an external data file. At this stage the editor should look like the following figure.

Fig 18: Time Series editor
- Now insert the following rainfall data in the editor. Here, a 3-inch 6-hour design storm information has been used.
Table 3: Rainfall time series data
Rain Format | Intensity | |
|---|---|---|
Time Step | 1.0 | hour |
Rain Gage ID | RG-1 |
Time (H:M) | Value (in/hr) |
|---|---|
0 | 0.0 |
1 | 0.5 |
2 | 1.0 |
3 | 0.8 |
4 | 0.5 |
5 | 0.3 |
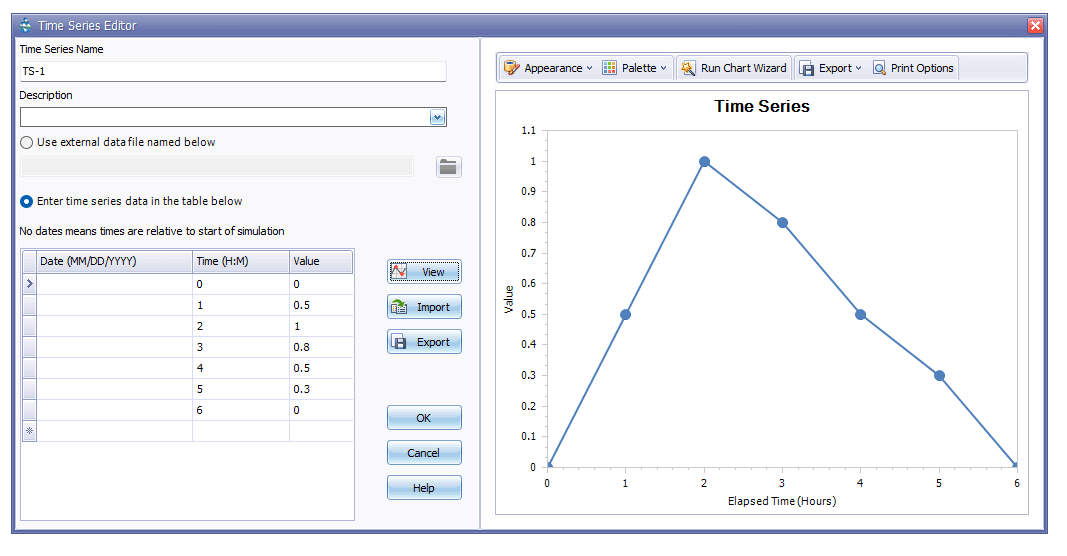
- Click on the View () button if you want to see the time series plot. It should look like the following figure.


Fig 19: Time series table and plot
-
Close the plot and then click OK to save the time series and exit from the editor.
-
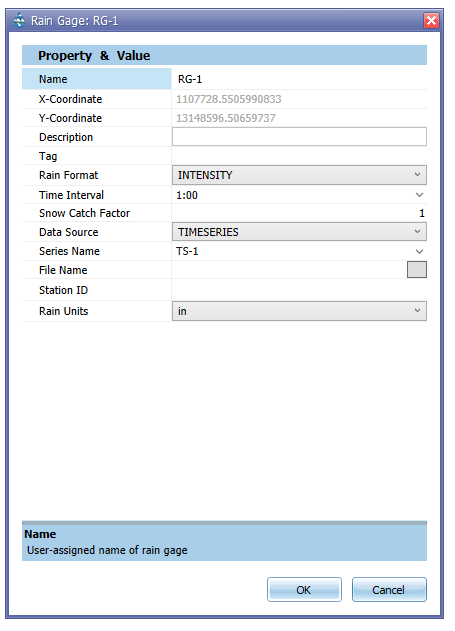
Now this time series needs to be assigned with the rain gage. To do so, open the property editor for rain gage RG-1. In the editor, specify TIMESERIES as Data Source and select TS-1 from the dropdown list as Series Name. It should look like the following figure.

Fig 20: Rain gage property editor
