Water Quality Simulation
GeoSWMM has a comprehensive water quality analysis and treatment module for any kind of drainage model. In this example, a land use based runoff pollutant will be analyzed. To incorporate the pollutant and associated land use in the model:
Go to the Model Object Panel and open Options editor. Specify Dynamic Wave as the routing model. Then Click OK to save the changes and exit from the editor.
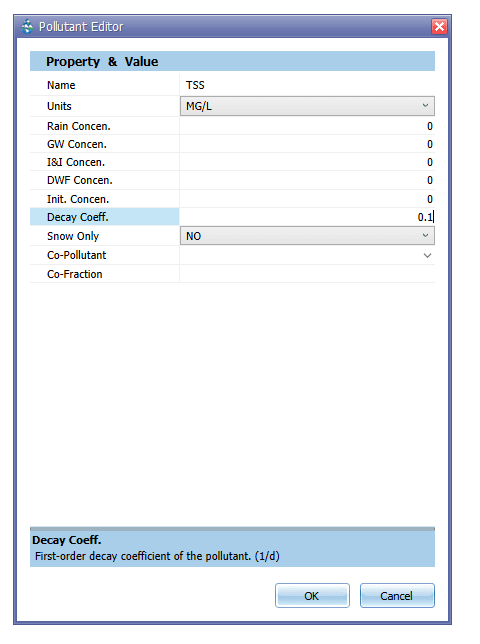
In Model Object Panel, select Pollutants. Then click on the Add () button to open the pollutant editor. Specify TSS (abbreviated for Total Suspended Solid) as the pollutant name. Leave other parameters with default values and click OK to save the pollutant. The editor should look like the following figure. Concentration of TSS is measured in MG/L.
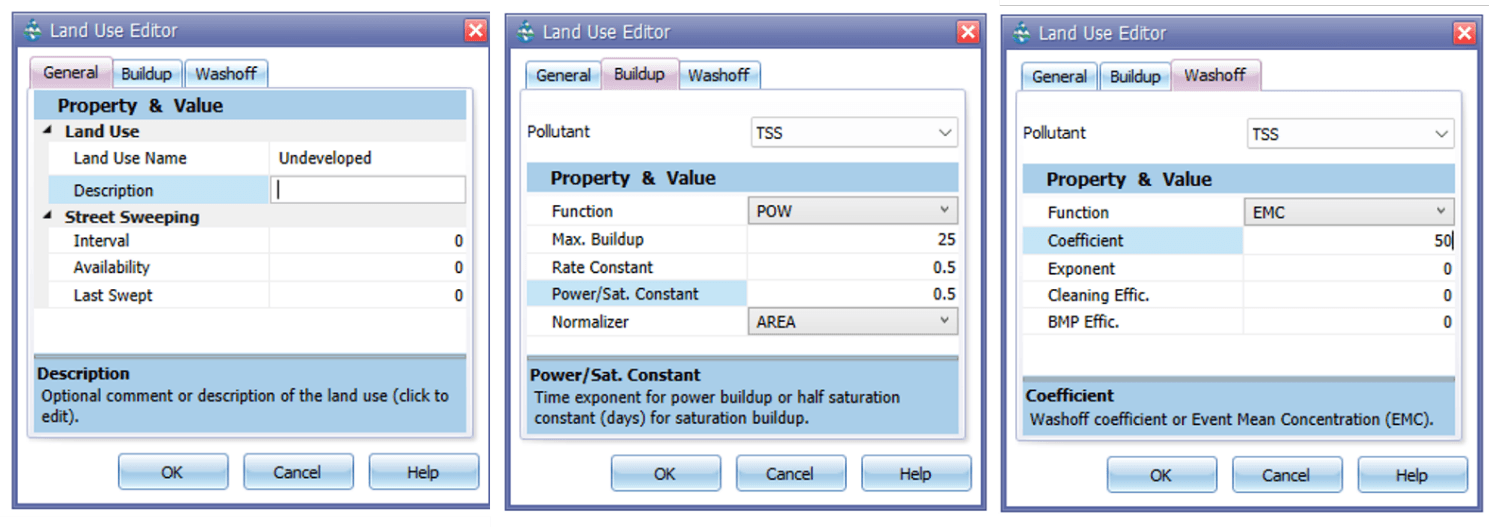
Now select Land Uses in the Model Object Panel and then click on the Add (![]() ) button to open the land use editor. Notice the three tabs- General, Buildup and Washoff. Specify Residential as the land use name in General page. Besides, insert the property values under Buildup and Washoff pages from the following table.
) button to open the land use editor. Notice the three tabs- General, Buildup and Washoff. Specify Residential as the land use name in General page. Besides, insert the property values under Buildup and Washoff pages from the following table.
Property | Parameter | Land Use Name | |
|---|---|---|---|
Residential | Undeveloped | ||
Buildup | Function | POW | POW |
Max. Buildup | 50 | 25 | |
Rate Constant | 1 | 0.5 | |
Power/Sat. Constant | 1 | 0.5 | |
Normalizer | AREA | AREA | |
Washoff | Function | EMC | EMC |
Coefficient | 100 | 50 | |
Exponent | 0 | 0 | |
Cleaning Effic. | 0 | 0 | |
BMP Effic. | 0 | 0 | |
Then click OK to save the land use and exit from the editor. Similarly create another land use with name- Undeveloped. Assign the properties for this land use also from the above table. After data has been inserted, the land use editor for Undeveloped should look like the following figure.
Then open the subcatchment element table. Go to field Land Uses and assign the following land use distribution data for the subcatchments.
Subcatchment ID | Percent of Area | |
|---|---|---|
Residential | Undeveloped | |
S-1 | 60 | 40 |
S-2 | 30 | 70 |
S-3 | 30 | 70 |
In the same element table, go to field Initial Buildup and specify a value of 5 lb/acre at each subcatchment. Then click OK to accept the change made and exit from the table. Initial buildup has been defined to analyze washoff characteristics of the pollutant by the storm event (recorded at rain gage RG-1) in the model.
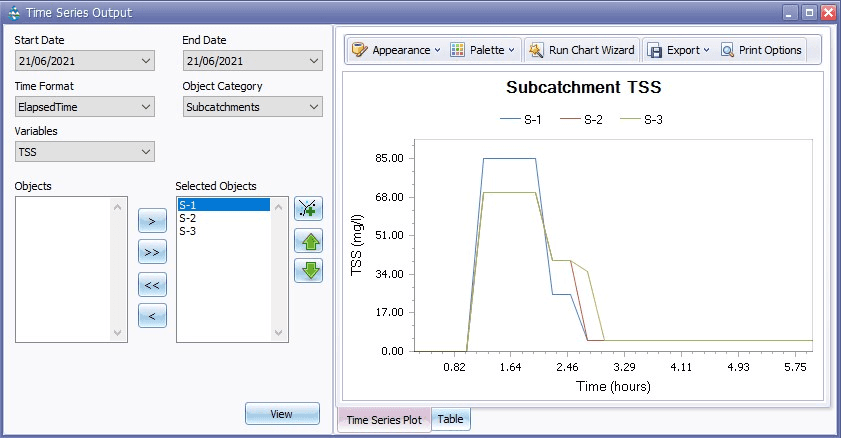
Now save the project and run the model. The model will show you quality simulation summary (washoff results) in the status report. Besides you can view the time series output of TSS for different subcatchments as illustrated below.