View Profile Plot
The Profile Plot manager generates simulated water elevation profiles along a connected path of drainage system links and nodes at a particular point in time. For example, to create an elevation profile from junction J-4 to outfall O-1:
- Go to the GeoSWMM tab Results Section and expand the gallery view and from Plots section click on the Profile Plot () button. The profile plot manager will open in a separate window.

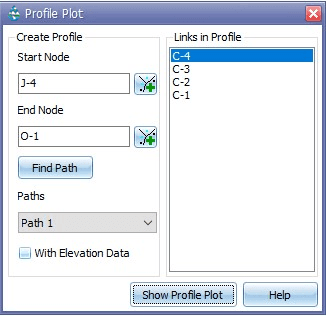
- Specify J-4 as Start Node and O-1 as End Node in the manager. Then click on the Find Path button to see the available items in the linkage. At this stage, the profile plot manager should look like the following figure.

Fig 31: Profile Plot manager
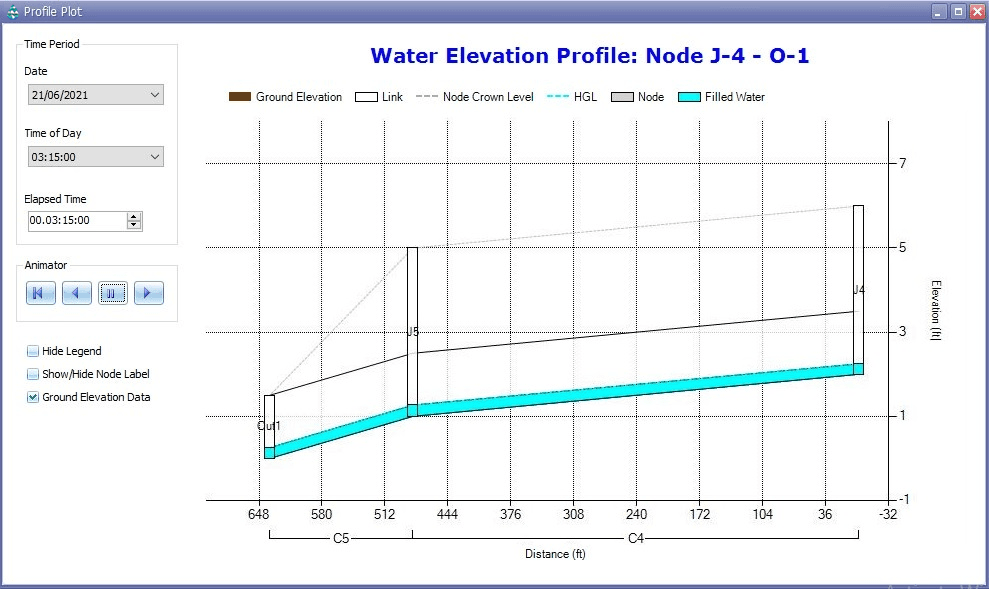
- Now click on the Show Profile Plot button. The profile map from junction J-4 to outfall O-1 will be displayed like the following figure. You can animate and observe the variation of water surface level within the reporting time steps in the profile plot window.

Fig 32: Profile Plot manager
- You can also perform the same plotting with the existing ground surface elevation on it. In that case you must extract the elevation of your study area from an elevation dataset (i.e. contours) by the Elevation Manager tool of GeoSWMM prior to performing with the Profile Plot manager. For more details visit at Elevation Manager.
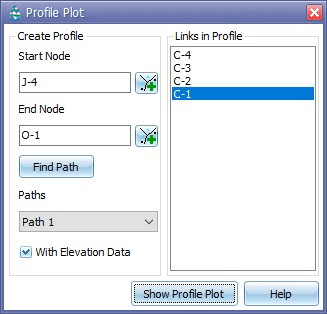
- When the extraction is done, complete steps 1 and 2 as before. Then check the Elevation Data option in the most bottom-left window. At this stage the window will look like the following figure.

Fig 33: Profile Plot window checked with elevation data
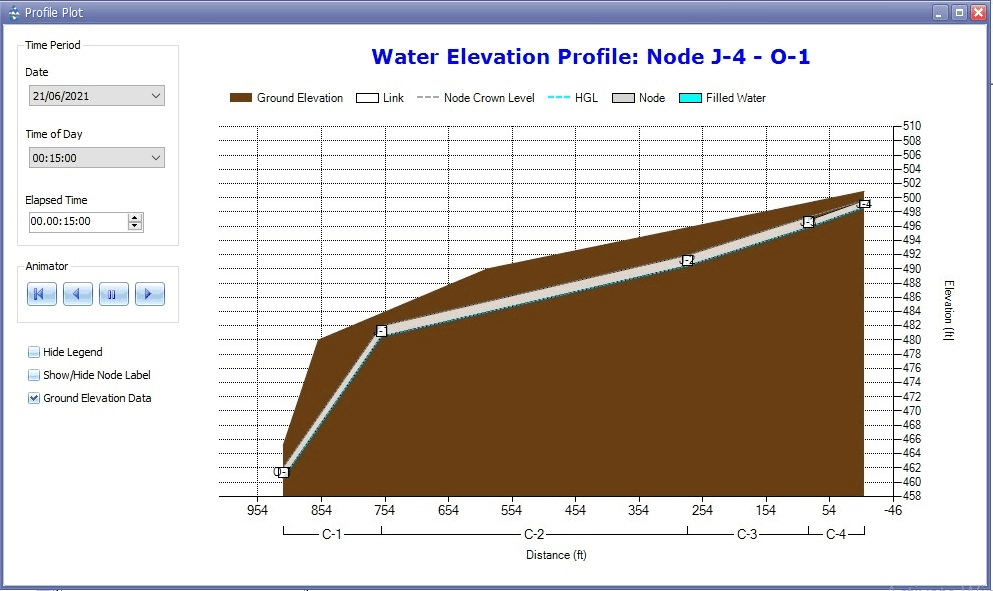
- Complete step 3 as before and the plotting window will appear like Fig 34.

Fig 34: Profile Plot with ground elevation
