View Time Series Plot
A time series plot graphs the values over time of specific combinations of objects and variables. Up to ten times series can be plotted on the same graph. To create a time series, plot the following needs to be done:
-
Go to the GeoSWMM tab Results Section and expand the gallery view and from Plots section and click on the Time Series Plot (
) button. It will display a time series plot manager.
-
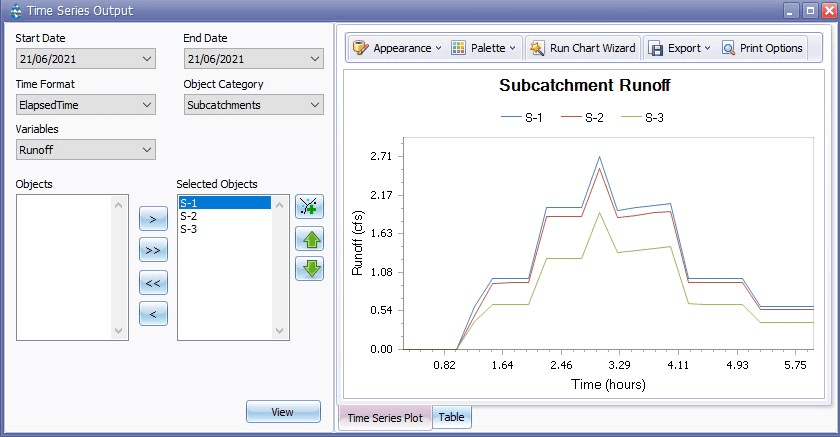
On the time series plot manager, specify what time interval and what pair of objects and variables to plot. For example: specify Subcatchments as Object Category, Runoff as Variables from the dropdown list, and subcatchments S-1, S-2 and S-3 as Selected Objects. Then click View button to generate the plot. It should look like the following figure.

Fig 27: Time Series Output manage
-
The general appearance of the chart can be defined using the *Appearance *option in the tool bar. Usually the ‘default’ appearance option is set and you can change it by clicking the option and choose different style from the drop-down list. Moreover, you can organize, customize and present the chart using *Run Chart Wizard *with a real-time preview. See in detail how to work with Run Chart Wizard.
-
After finishing the customization or keeping the default, you can export the chart in Pdf, Html, Mht, Rtf or Different Image formats clicking Export on the tool bar of the Time Series Plot Window. Moreover, the *Printing Options *button in the tool bar will allow you to edit the customized chart and print it by opening a separate window.
-
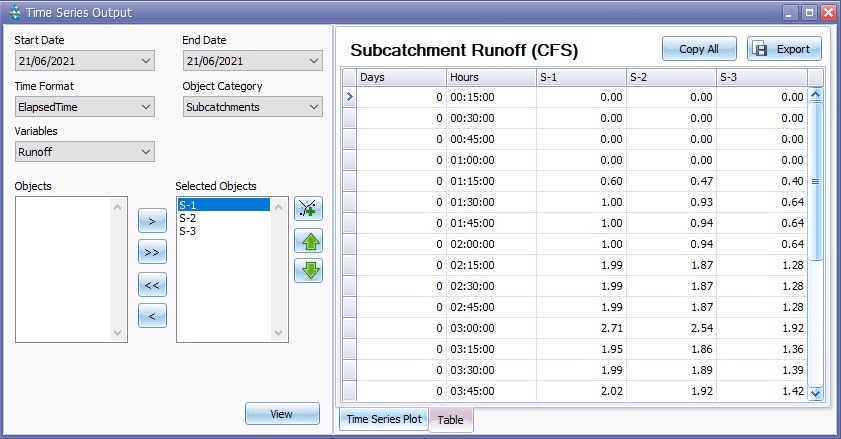
You can also extract time-based values of the specified variable for those specific objects by clicking the bottom *Table *tab in the Scatter Plot window and export this table by clicking the Export button on the top-right side of the window. Then you will need to browse the targeted file location in your computer to complete the process. It will look like the following figure:

Fig 28: Table tab in Time Series Output window
